I am new to this subject so I would really appreciate if anyone could help me I study civil engineering and I am currently working on my master thesis, where I wanted to implement PCE. However even though I followed the examples and read the user manual on PCE, i still can’t seem to get a pretty decent prediction based on my data. I just want to make sure that the problem is the data and not the code. Since I am a new user, I can’t upload attachments.
Welcome to UQLab!
Could you please report the LOO error?
You can find a fruitful discussion in Acceptable LOO Error to learn more about this magic test.
Besides, try a bigger adaptive degree range by using:
------------ Polynomial chaos output ------------
Number of input variables: 2
Maximal degree: 5
q-norm: 1.00
Size of full basis: 21
Size of sparse basis: 10
Full model evaluations: 639
Leave-one-out error: 3.5708562e-02
Validation error: 1.0688788e+00
Mean value: 48.2893
Standard deviation: 1.2510
Coef. of variation: 2.591% --------------------------------------------------
and after i changed the degree and the q-norm
------------ Polynomial chaos output ------------
Number of input variables: 2
Maximal degree: 9
q-norm: 0.70
Size of full basis: 31
Size of sparse basis: 11
Full model evaluations: 639
Leave-one-out error: 3.3236391e-02
Validation error: 1.1930977e+00
Mean value: 48.2682
Standard deviation: 1.3155
Coef. of variation: 2.725% --------------------------------------------------
my data doesn’t exactly fit any distribution, so it might be that. I was just confused why i was getting a better approximation with the polynomial regression method
In order to address this problem, please follow my suggestions:
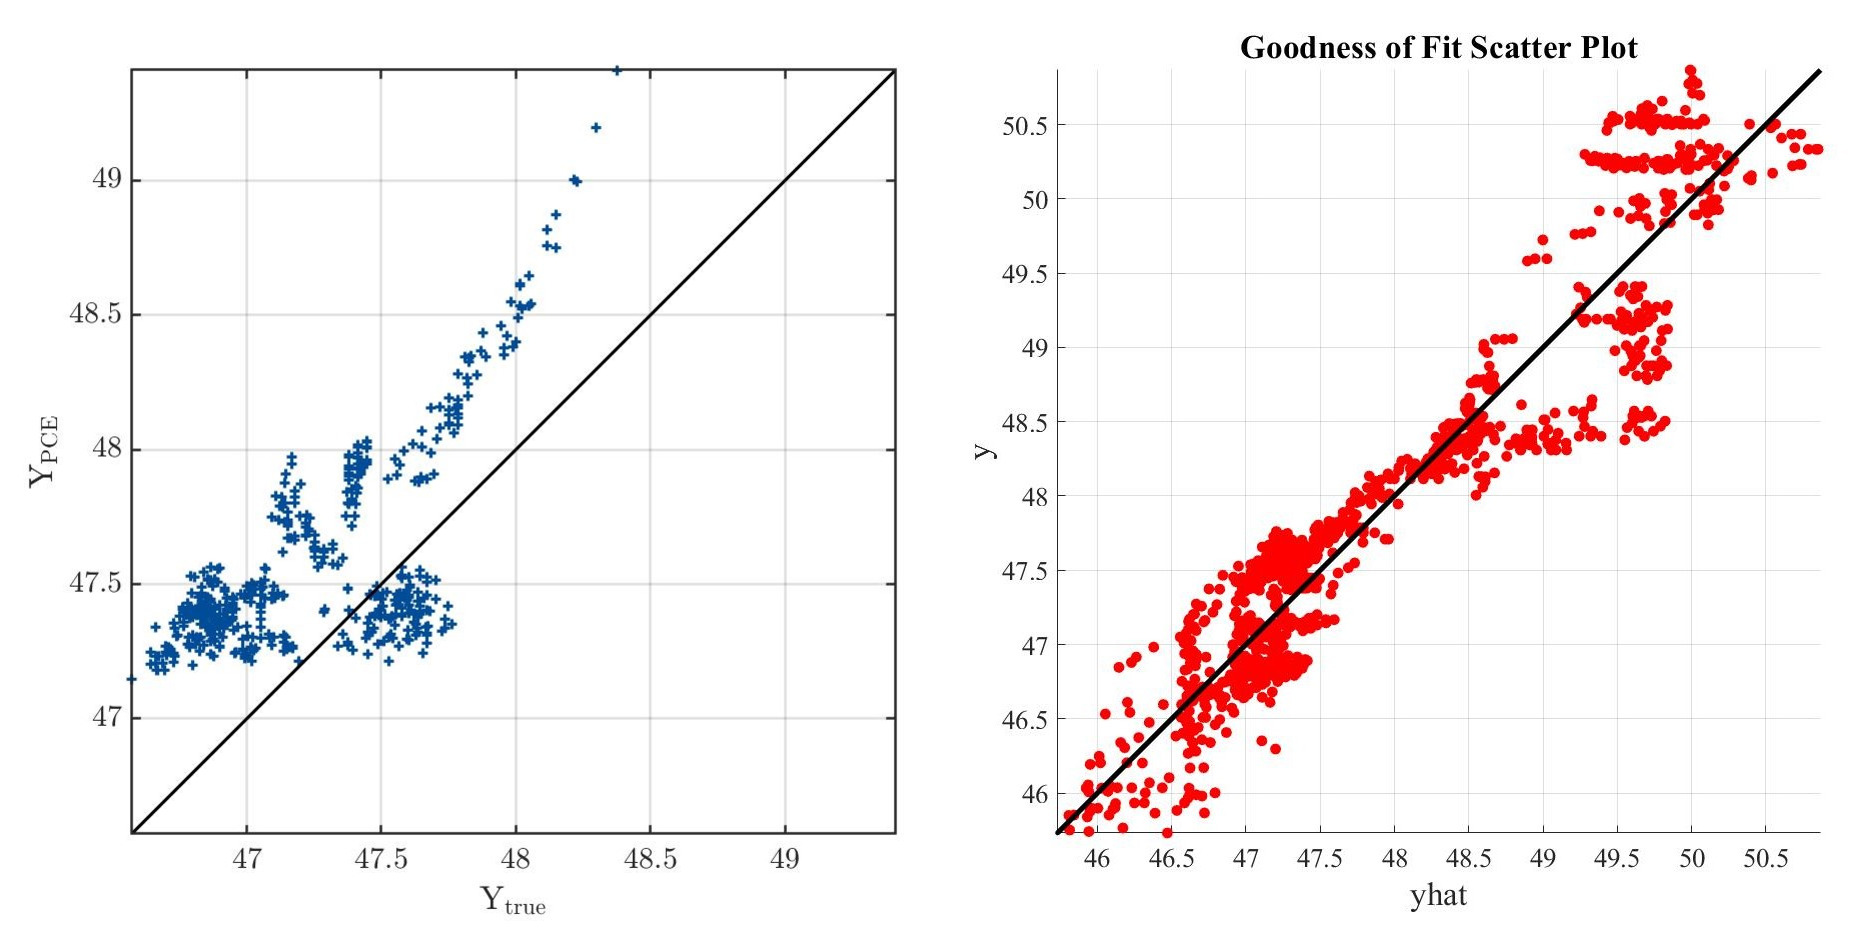
Due to the validation error and the YY plot, your analysis suffers from lack of accuracy. Based on Sec 2.7 in UserManual_PCE. I cant understand the following codes:
It seems you assume inappropriate marginals. Please change your code based on Sec 2.7 and report the changes.
In addition to Ali’s suggestions, I would suggest the following:
It is unusual that the LOO error is so small, and then the validation error is larger than 1. There might be an issue with your validation set. How large is it? Are the training set and the validation set sampled from the same distribution? Your data is two-dimensional, so it is easy to visualize: Plot your training data (X) and the validation data (Xval) in the same figure and confirm visually that they follow the same distribution. How does the distribution look like? Is there maybe dependence in the X-data?
Make a scatter plot of your data and the corresponding model output by using the Matlab command scatter with filled circles that are colored according to the output value. Does the color vary smoothly over the input domain, or are there jumps in the data (or outliers)? Polynomial approximation works best when the model is smooth and varying slowly.
Note that regression-based PCE is a form of polynomial regression, just with a special polynomial family, and in the case of UQLab, by default using a sparsity constraint (LARS). The pictures that you show (the left one from PCE, the right one from “polynomial regression”?) use a very different set of points, which might explain the difference.
Hello. Sorry I have a question regarding this topic:
What are the differences between "Leave-one-out error " and “Validation error”?
I am able to find "leave-one-out error " from my PCE model, however, how can I find “Validation error”?
Thanks
Thanks for your question!
The LOO error is discussed comprehensively in the mentioned question,Acceptable LOO Error.
The main reasons to apply this magic tool are:
1- Overcoming the problem of “overfitting”
2- Scare validation set due to the high computational cost of the real model (e.g. Nonlinear FEM)
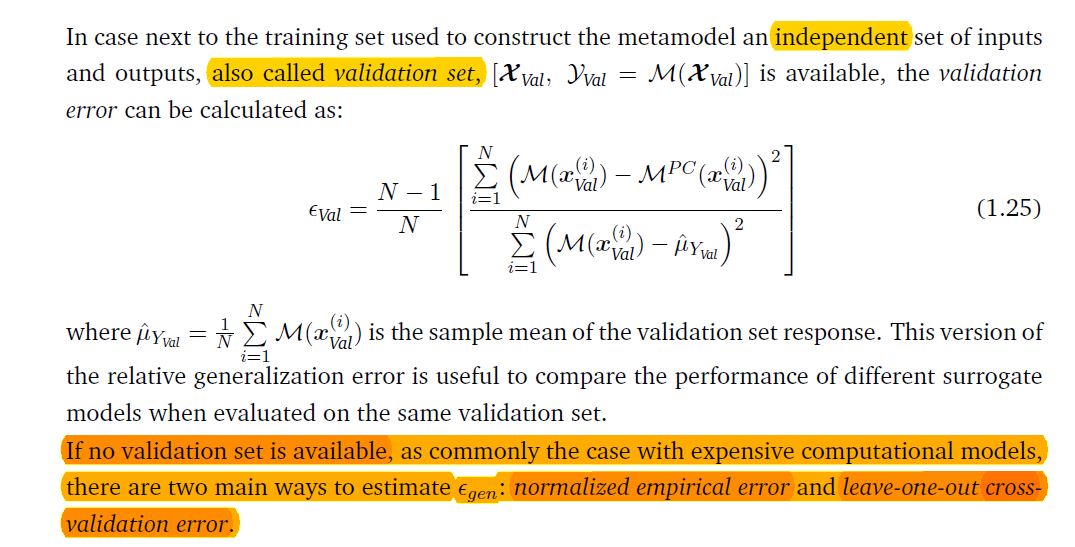
As UserManual_PCE discussed, its important to use independent validation set:
About your question:
If you run your metamodels in UQLab, the LOO error is automatically calculated but for the “Validation Error” you must have dataset!
In this context, you could run examples from your UQ_Example such as:
 I study civil engineering and I am currently working on my master thesis, where I wanted to implement PCE. However even though I followed the examples and read the user manual on PCE, i still can’t seem to get a pretty decent prediction based on my data. I just want to make sure that the problem is the data and not the code. Since I am a new user, I can’t upload attachments.