Dear Truong,
by investing the UQLab-code in uq_infer_marginals.m I deduced that one had to use the string 'LogNormal' to refer to lognormal distribution and that neither 'lognormal' or 'Lognormal' can
be used instead.
But, also correctly requesting a lognormal approximation seems not to provide a better approximation, see
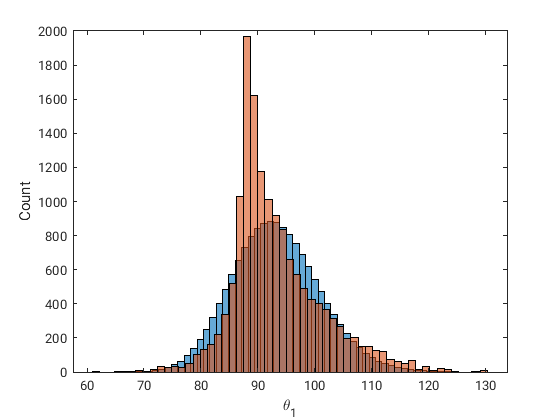
Comparing the histogram for lognormal samples with a plot for the lognormal PDF using
the parameters in the output of uq_print(mydist_infer) it seems that the computed samples
represent the corresponding lognormal distribution with the given parameters.
So, it seems to me that the approximation of your data points generated by a lognormal distribution
resulting by using the `‘KS’ criterion is not better then the one by a normal distribution in auto mode.
Maybe an other criterion may help, but this is not my field of expertise,sorry.
Below pleas find my variation of your code.
Greetings
Olaf
% Inference of the samples created in MCMC
PostSample3D = myBayesianAnalysis_surrogateModel.Results.PostProc.PostSample ;
PostSample2D = reshape(permute(PostSample3D, [2 1 3]), size(PostSample3D, 2), [])';
iOpts.Inference(1).Data = PostSample2D(:,2) ;
% iOpts.Marginals(1).Type = {'Gaussian', 'Exponential', 'Weibull'}; % works
% iOpts.Marginals(1).Type = 'ks'; % works
% iOpts.Marginals(1).Type = {'Gaussian', 'ks', 'Lognormal'}; % Doesn't work
% iOpts.Marginals(1).Type = 'Lognormal'; % Doesn't work
iOpts.Marginals(1).Type = 'LogNormal'; % works

iOpts.Copula(1).Type = 'Independent';
iOpts.Inference(1).Criterion = 'KS';
mydist_infer = uq_createInput(iOpts);
uq_print(mydist_infer)

%Creation of samples from the two post-inputs
Xtest_inf= uq_getSample(mydist_infer , 15000, 'LHS');

% % hold on to the existing plot and add a histogram of the second dataset
figure
histogram(Xtest_inf,55)
%histfit(PostSample2D(:,2),55,'loglogistic') %Checking matlab's default
hold on
histogram(PostSample2D(:,2),55)

xlabel('\theta_1')
ylabel('Count')

% Comapring plot
figure
histogram(Xtest_inf,55)
xlabel('\theta_1')
ylabel('Count')


figure
x=min(PostSample2D(:,2)):0.01:max(PostSample2D(:,2));
% values Parameter values  from output of uq_print(mydist_infer)
y = lognpdf(x,4.531e+00, 8.173e-02 );
plot (x,y)

figure
histogram(log(PostSample2D(:,2)),55)

xlabel('log(\theta_1)')
ylabel('Count')

figure
histogram(log(log(PostSample2D(:,2))),55)

xlabel('log(log(\theta_1))')
ylabel('Count')
`