Obtaining a better parameter marginal fit

I have run into a (probably ignorant) issue defining a new input when using the statistical inference module.

I have some data that looks to be lognormal and I am hoping to propregate the distribution for further bayesian inference.

untitled

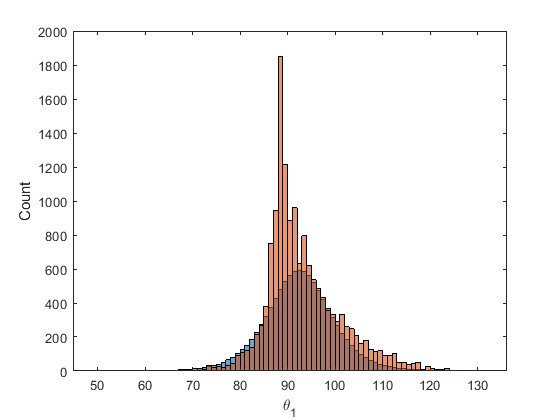
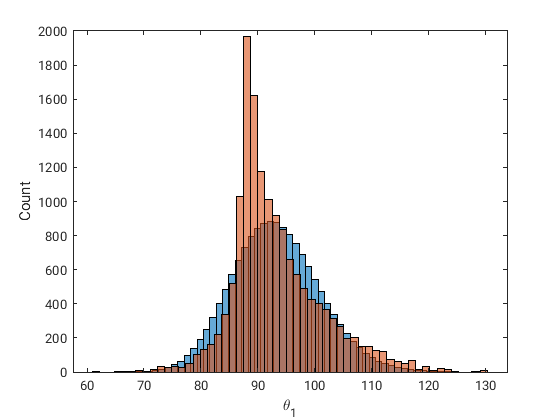
The red histogram is the output of the Bayesian inference and the blue is the infered marginal.

The relevant snippet of code is provided below. The data is uploaded as a zip file.

Any help would be greatly appreciated :slight_smile:

I would like to add that I have tried all the inferences criterion, and defining various marginal families to no greater success than the default.

Regards,

Truong

UQLAB_QUERY2.zip (1.5 MB)

% Inference of the samples created in MCMC
PostSample3D = myBayesianAnalysis_surrogateModel.Results.PostProc.PostSample ; 
PostSample2D = reshape(permute(PostSample3D, [2 1 3]), size(PostSample3D, 2), [])';
iOpts.Inference.Data = PostSample2D(:,2) ; 
iOpts.Marginals.Type = 'auto';
iOpts.Copula.Type = 'Independent';
iOpts.Inference.Criterion = 'KS';
mydist_infer = uq_createInput(iOpts);
uq_print(mydist_infer)

%Creation of samples from the two post-inputs 
Xtest_inf= uq_getSample(mydist_infer , 10000, 'LHS');

% % hold on to the existing plot and add a histogram of the second dataset
figure
histogram(Xtest_inf,'BinMethod','auto')

hold on
histogram(PostSample2D(:,2))

xlabel('\theta_1')
ylabel('Count')

Dear Truong,

it seems to me that UQLab tries to represent your data by a normal distributed random variable, thanks to the automatic choice for the marginal family thanks to iOpts.Marginals.Type = 'auto'; .
Maybe you should try to define the marginal family to be log-normal distributions by iOpts.Marginals.Type = 'Lognormal' ;

Greetings
Olaf

Hi Olaf,

I am able to get good agreement by using non-parametric inference. I have yet to see what the implications are for further Bayesian inference.

I still cannot figure out why I cannot use ‘lognormal’ as a marginal type.
Also there is an issue with this line: iOpts.Marginals(1).Type = {'Gaussian', 'Exponential', 'Weibull'};
Works fine as is but doesnt work when I change one of the entries to 'ks'. It might be that it doesnt like parameteric mixed with non-parametric?

Maybe someone on the programming team can help.

Below is the code for verification:

%%

% Inference of the samples created in MCMC
PostSample3D = myBayesianAnalysis_surrogateModel.Results.PostProc.PostSample ; 
PostSample2D = reshape(permute(PostSample3D, [2 1 3]), size(PostSample3D, 2), [])';
iOpts.Inference(1).Data = PostSample2D(:,2) ; 
iOpts.Marginals(1).Type = {'Gaussian', 'Exponential', 'Weibull'}; % works
% iOpts.Marginals(1).Type = 'ks'; % works
% iOpts.Marginals(1).Type = {'Gaussian', 'ks', 'lognormal'}; % Doesn't work
iOpts.Copula(1).Type = 'Independent';
iOpts.Inference(1).Criterion = 'KS';
mydist_infer = uq_createInput(iOpts);
uq_print(mydist_infer)

%Creation of samples from the two post-inputs 
Xtest_inf= uq_getSample(mydist_infer , 15000, 'LHS');

% % hold on to the existing plot and add a histogram of the second dataset
figure
histogram(Xtest_inf,55)
%histfit(PostSample2D(:,2),55,'loglogistic') %Checking matlab's default
hold on
histogram(PostSample2D(:,2),55)

xlabel('\theta_1')
ylabel('Count')

Dear Truong,

by investing the UQLab-code in uq_infer_marginals.m I deduced that one had to use the string 'LogNormal' to refer to lognormal distribution and that neither 'lognormal' or 'Lognormal' can
be used instead.

But, also correctly requesting a lognormal approximation seems not to provide a better approximation, see
LogNorrmalApprox

Comparing the histogram for lognormal samples with a plot for the lognormal PDF using
the parameters in the output of uq_print(mydist_infer) it seems that the computed samples
represent the corresponding lognormal distribution with the given parameters.

So, it seems to me that the approximation of your data points generated by a lognormal distribution
resulting by using the `‘KS’ criterion is not better then the one by a normal distribution in auto mode.
Maybe an other criterion may help, but this is not my field of expertise,sorry.

Below pleas find my variation of your code.

Greetings
Olaf

% Inference of the samples created in MCMC
PostSample3D = myBayesianAnalysis_surrogateModel.Results.PostProc.PostSample ; 
PostSample2D = reshape(permute(PostSample3D, [2 1 3]), size(PostSample3D, 2), [])';
iOpts.Inference(1).Data = PostSample2D(:,2) ; 
% iOpts.Marginals(1).Type = {'Gaussian', 'Exponential', 'Weibull'}; % works
% iOpts.Marginals(1).Type = 'ks'; % works
% iOpts.Marginals(1).Type = {'Gaussian', 'ks', 'Lognormal'}; % Doesn't work
% iOpts.Marginals(1).Type = 'Lognormal'; % Doesn't work
iOpts.Marginals(1).Type = 'LogNormal'; % works

iOpts.Copula(1).Type = 'Independent';
iOpts.Inference(1).Criterion = 'KS';
mydist_infer = uq_createInput(iOpts);
uq_print(mydist_infer)

%Creation of samples from the two post-inputs 
Xtest_inf= uq_getSample(mydist_infer , 15000, 'LHS');

% % hold on to the existing plot and add a histogram of the second dataset
figure
histogram(Xtest_inf,55)
%histfit(PostSample2D(:,2),55,'loglogistic') %Checking matlab's default
hold on
histogram(PostSample2D(:,2),55)

xlabel('\theta_1')
ylabel('Count')

% Comapring plot
figure
histogram(Xtest_inf,55)
xlabel('\theta_1')
ylabel('Count')


figure
x=min(PostSample2D(:,2)):0.01:max(PostSample2D(:,2));
% values Parameter values  from output of uq_print(mydist_infer)
y = lognpdf(x,4.531e+00, 8.173e-02 );
plot (x,y)

figure 
histogram(log(PostSample2D(:,2)),55)

xlabel('log(\theta_1)')
ylabel('Count')

figure 
histogram(log(log(PostSample2D(:,2))),55)

xlabel('log(log(\theta_1))')
ylabel('Count')

`