Hi,
I’m majoring in chemical engineering.
i’m conducting research to simulate the process using simulation programs such as Aspen.
PCE has the advantage that it can produce good results with less data than MC, so I want to apply PCE to my research.
I’m using PCE to approximate the underlying function and do a sensitivity analysis.
Before proceeding with the above research, first, i will extract data using simulation program.
At this point, i want to use a sampling technique such as LHS to obtain the data points that need to be extracted. (If the data extraction point is randomly selected, the model does not perform well. Aspen simulation data is a time-consuming task.)
Assume that the input of data consists of x1, x2, and x3. At this time, the distribution of x1, x2, x3 is unknown. Can I assume this is uniform distribution like in uq_Example_input_01_Sampling?
Additional question. Last time, when setting the moment and type required to generate a PCE model, you answered that i use plotmatrix to see the distribution. (Thank you for your kind reply.) The picture below shows the Truss data using plotmatrix.
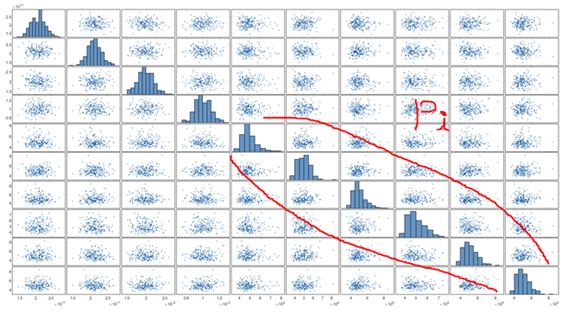
In the above figure, all the distributions represented by Pi are expressed as Gumbel as Type, Mean as 50000, and Standard Deviation as 7500.
In the figure, the shape of the distribution is similar, but the specific parameters of the distribution are likely to be different.
Is there a criterion (or tip) for determining the distribution of input data? Or is it just a toy problem, so is it rough?
Finally, the question is about copula. Studying manual, copula seems to be an indicator of the dependencies between variables. This is also an option for creating PCE models. This is a low level question, but what exactly does the copula function do?
(I don’t understand the result of the copula function example.)
(How do i determine if the data is dependent on each other or independent? Based on knowledge?)