Dear Paul-Remo,
I think I found again a hidden error.
After increasing the number of Solver.MCMC.NChains to 500 and the number of Solver.MCMC.Step to 600 and performing Bayesian Inference for a model with 29 output components by calling myBayesianAnalysis = uq_createAnalysis(BayesOpts), I got an error message during the creation of the scatter plot during the evaluation of uq_display(myBayesianAnalysis) (see below).
Using the debugger, I figured out that the problem seems to be the line 278 in your new version of uq_display_uq_inversion.m:
PlotId = round(rand(NMaxPlot,1)*size(scatterplotPost_Sample,1));
which is only evaluated if 1E5= NMaxPlot < size(scatterplotPost_Sample,1),
which is not the case in the typical examples. The following call of scatterplotPost_Sample(PlotId,scatterplotParams);
in the line 282 afterwards generates the error message
Subscript indices must either be real positive integers or logicals.

Error in uq_display_uq_inversion (line 282)
PostSample = scatterplotPost_Sample(PlotId,scatterplotParams);

Error in uq_module/Display

Error in uq_display (line 4)
%    uq_createModel, uq_createInput or uq_createAnalysis commands. The

Error in Scr_extr_UQLab_1st_dec_2a (line 106)
uq_display(myBayesianAnalysis)
…
It seem to me that scatterplotPost_Sample has problems since in general some components in PlotId defined according to the above equation will coincide. Moreover, in some situations at lest one component of PlotId may be equal to 0, which also creates problems when calling scatterplotPost_Sample. Replacing the above code in the line 278 by
   PlotId = 1+unique( round(rand(NMaxPlot,1)*...
                     (size(scatterplotPost_Sample,1)-1)));
I could not observe any error message during several further evaluation of
uq_display(myBayesianAnalysis) using myBayesianAnalysis with the same the same contents as above.
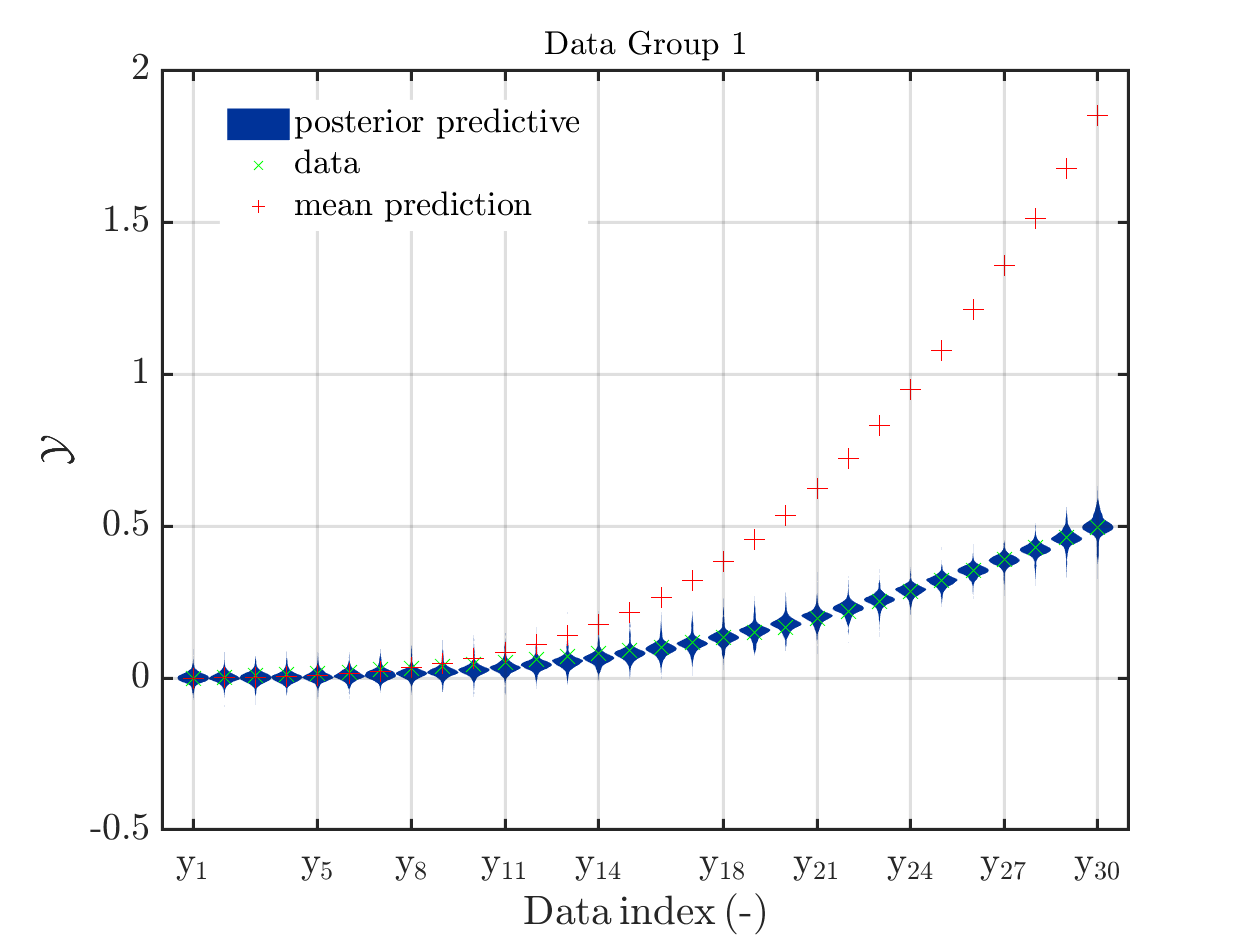
One further remark, I would be grateful if it would be pointed out in the manual, e.g. in the discussion of the parameters for uq_display, that the mean prediction shown in the data group plot is not the mean of the ``posterior predective’’ density also shown in these plot, but the model output at the mean of the samples for the model parameters. For nonlinear models these two values can be quite different, especially if one is considering results of uq_createAnalysis performed with using too few steps the MCMC-solver, as in my intermediate result:

Greetings
Olaf