I am trying to create a PCE model from pre-existing discrete data. I have one input variable (Xtrain) and one output variable (Ytrain), both discrete. I have created a Kernel Density Estimation to make it continuous for the input:
KDE_Marginals = uq_KernelMarginals(Xtrain);
InputOpts.Marginals = KDE_Marginals;
myInput = uq_createInput(InputOpts);
Then I gave the discrete inputs into ExpDesign:
MetaOpts_OLS.ExpDesign.X = Xtrain;
MetaOpts_OLS.ExpDesign.Y = Ytrain;
Here are the parameters I specified for the PCE:
MetaOpts_OLS.Type = 'Metamodel';
MetaOpts_OLS.MetaType = 'PCE';
MetaOpts_OLS.Method = 'OLS';
MetaOpts_OLS.Degree = 1:30;
I then evaluated it from seperate testing data that I had split from the original X:
YOLS = uq_evalModel(myPCE_OLS, Xtest);
For visualization, this is the constant output I’m seeing:
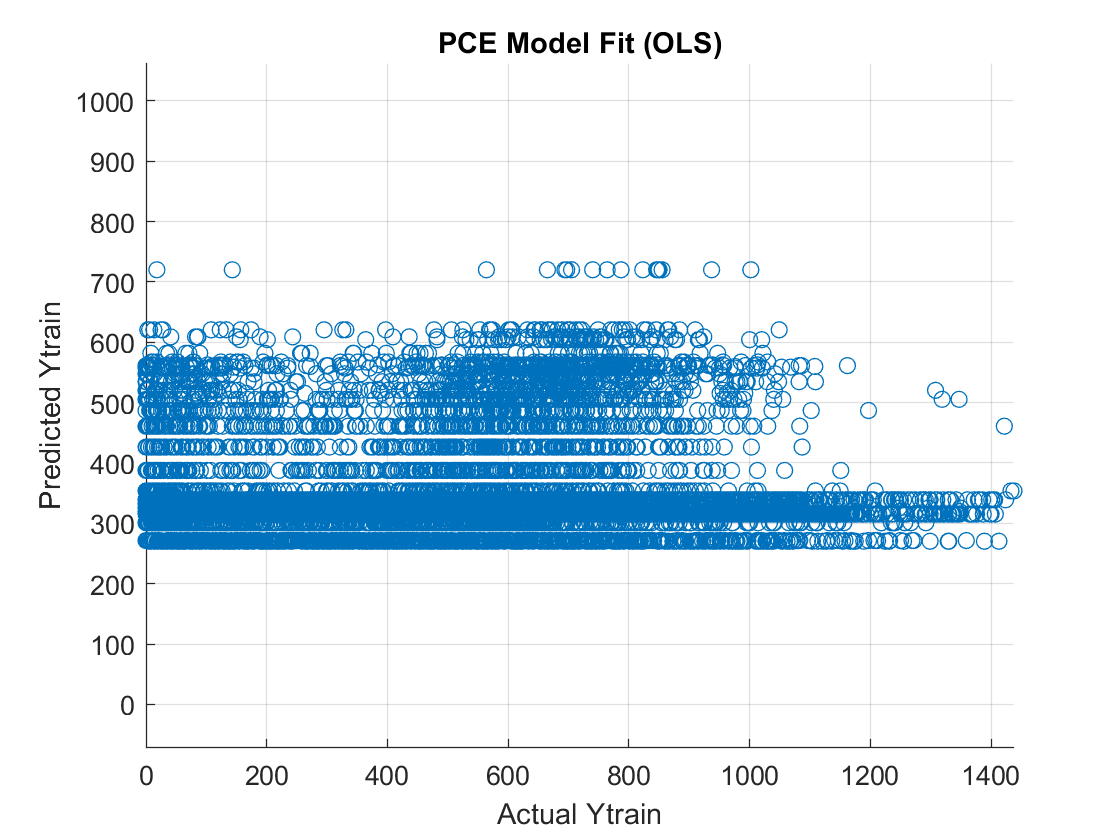
And comparing the STD and MEAN of the PCE and Actual:
%PCE output:
disp(std(uq_evalModel(myPCE_OLS, Xtest))); %result STD: 63
disp(mean(uq_evalModel(myPCE_OLS, Xtest))); %result MEAN: 333

%Actual Data:
disp(std(Ytest)); %result STD: 312
disp(mean(Ytest)); %result MEAN: 331
Clearly, the PCE model is giving a pretty constant output from my data. My Xtrain varies from (0,30), and my Ytrain varies from (0,1438), so the model shouldn’t be constant. Any ideas on why I’m getting a PCE constant output? I’ve tried tweaking the Degree, and have tried all other Coefficient Calculation Techniques. I’ve also checked the KDE is a good estimate, and it’s pdf graph matches the Xtrain pdf histogram very well.