Dear @Paulremo, (dear all),
I do not think that the plots generated by my solution generates inconsistencies in the chain indices on the x-axis, since these indices are just the indices of the chain in the myBayesianAnalysis.Results.Sample field, and I view of my investigation of the code in uq_postProcessInversion these seems to be the indices values that one needs to know. Yes, these indices differ from the indices of the chains if there are considered in the myBayesianAnalysis.Results.PostProc.PostSample field which you seem to denote as true chain indices.
One would your "true chan indices’ if one would try to remove this chain by using some matlab commands to change the contents of the components of myBayesianAnalysis.Results.PostProc directly which is not recommended, since one can easily corrupt the contents of
myBayesianAnalysis.Results.PostProc. Instead, one should use uq_postProcessInversion to “remove” further chains, but then one needs the index of the chain in
the 'myBayesianAnalysis.Results.Sample field and not the index
in myBayesianAnalysis.Results.PostProc.PostSample.
This holds since uq_postProcessInversion is not updating the contents of myBayesianAnalysis.Results.PostProc.but is recreating them, so also an other post by me with suggestions for the manual
Hence, the contents of myBayesianAnalysis.Results.PostProc.PostSample are genrated from a fresh copy of myBayesianAnalysis.Results.Sample, and in this copy afterwards contents are removed according the values for 'burnIn' and 'badChains' in the current call of uq_postProcessInversion; the same is done for other components of myBayesianAnalysis.Results.PostProc.
For example, if one starts by uq_postProcessInversion(myBayesianAnalysis,'badChains',1) to “remove” the first chain, and deduces after further investigations that one also wants to remove the 3rd chain in myBayesianAnalysis.Results.PostProc.PostSample, which corresponds
to 4th chain in myBayesianAnalysis.Results.Sample, one needs the command
uq_postProcessInversion(myBayesianAnalysis,'badChains',[1 4])
to "remove also 4th chain’. (By using uq_postProcessInversion(myBayesianAnalysis,'badChains', 4) one would “remove” the 4th chain in the copy of myBayesianAnalysis.Results.Sample being the 3rd chain in myBayesianAnalysis.Results.PostProc.PostSample but one would also accidantedly undelete the “removed” first chain. )
Further remark:
During the creating of this post I realized that the method for creating the input for badChains using the squeeze command that I learned from Sec 6.3 of INVERSION: PREDATOR-PREY MODEL CALIBRATION and use also in my example below is not discussed in user manual yet. I suggest to present this method in the user manual and to point in table 19 that the input value for badChains can also be a logical array.
Acceptance plots with marked bad chains
For those, who do not want to wait for the next UQLab version to be able to generate acceptance plots with marked bad chains, below please find my brute force approach allowing to generate corresponding plots, see below the code example. The complete code example requires to apply the change in uq_display_uq_inversion.m discussed discussed my post above. If yoo do not want If one want to generated the these kind of plots without changing ‘uq_display_uq_inversion.m’ can can generte them simply after creating the contents of badChainsIndex but before “removing” this chains by calling uq_postProcessInversion.
% part 1
uq_Example_Inversion_04_PredPrey
% start of acceptance plot with marked bad chains
uq_display(myBayesianAnalysis, 'acceptance', true);
hold on;
% The following two lines are needed since the array badChainsIndex created
% by uq_Example_Inversion_04_PredPrey is an logical field of length
% Solver.MCMC.NChains with badChainsIndex(cNumber) being equal to 1/true,
% if and onlu if the chain cNumber identified as bad chain
% If one start with an arrya badChainsList being a list of the indices
% of chains considered as bad chains, one can replace the following two
% lines by
% BadChainIndexIndex = badChainsList
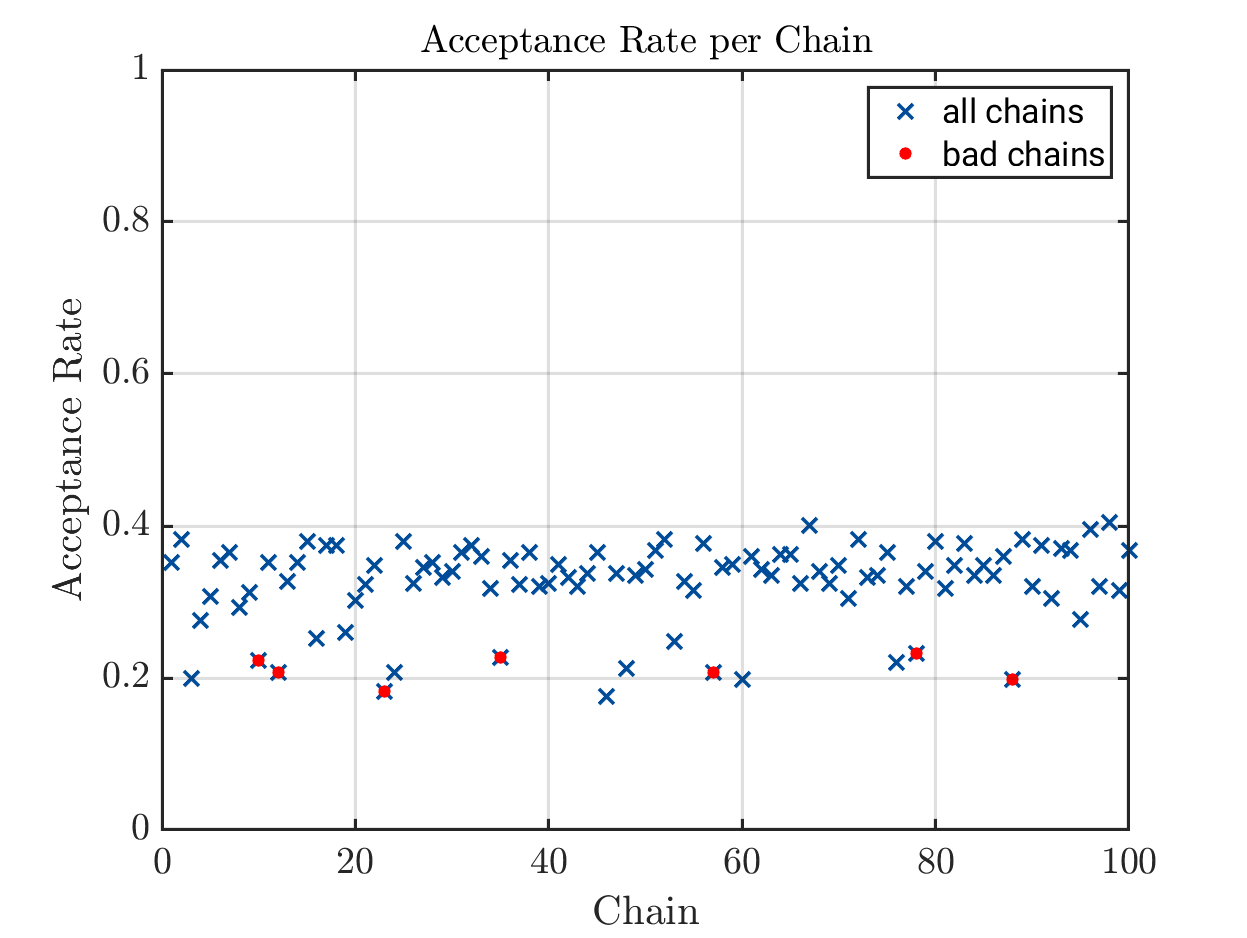
ChainIndex =1:Solver.MCMC.NChains;
BadChainIndexIndex = ChainIndex(badChainsIndex)
BadChainAccpetancw = myBayesianAnalysis.Results.Acceptance(badChainsIndex)
scatter(BadChainIndexIndex,BadChainAccpetancw, 'red', 'filled');
% 'Displayname','bad chains');
legend('all chains', 'bad chains');
% end of acceptance plot with marked bad chains
% part 2
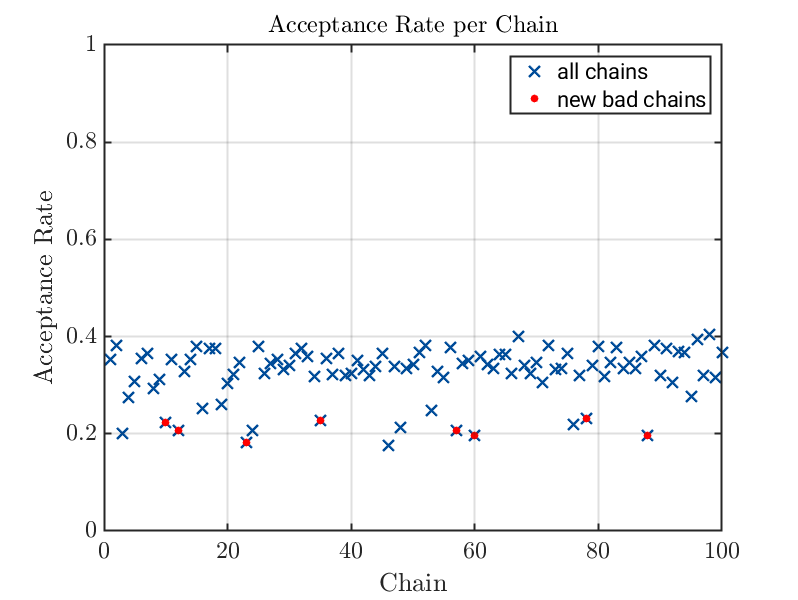
% in view of the acceptance plot also the chain with the index
% 60 should be considered as bad chain. Hence, the logical index list of
% bad chains is copied and also chain 60 is markes as baad chain
% and in the call of uq_postProcessInversion afterwards this
% extened list of bad chains is removed.
newbadChainsIndex = badChainsIndex
newbadChainsIndex(60) = true;
% uq_postProcessInversion(myBayesianAnalysis);
uq_postProcessInversion(myBayesianAnalysis,...
'badChains', newbadChainsIndex,...
'prior', 1000,...
'priorPredictive', 1000,...
'posteriorPredictive', 1000);
uq_display(myBayesianAnalysis)
% start of second acceptance plot with marked bad chains
uq_display(myBayesianAnalysis, 'acceptance', true);
hold on;
ChainIndex =1:Solver.MCMC.NChains;
newBadChainIndexIndex = ChainIndex(newbadChainsIndex)
newBadChainAccpetancw = myBayesianAnalysis.Results.Acceptance(newbadChainsIndex)
scatter(newBadChainIndexIndex,newBadChainAccpetancw, 'red', 'filled');
% 'Displayname','bad chains');
legend('all chains', 'new bad chains');
% end of second acceptance plot with marked bad chains
% part 3
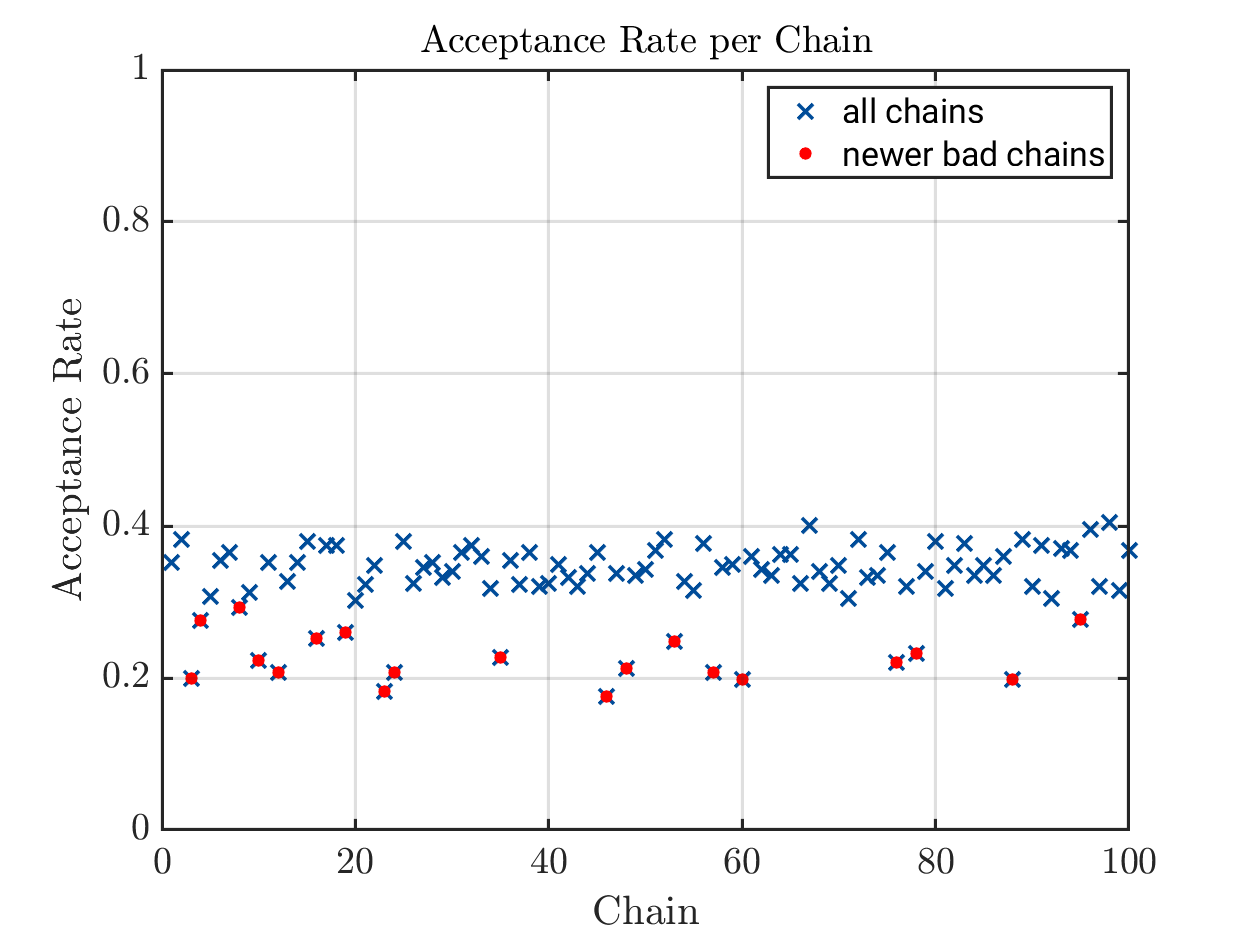
% in view of the acceptante plot, one deciedes that all chain with an
% acceptance rate smaller then 0.3 shuld be marked as badchains
% Following the example in uq_Example_Inversion_04_PredPrey this is donce
% by the following code.
newerbadChainsIndex = squeeze(myBayesianAnalysis.Results.Acceptance < 0.3);
uq_postProcessInversion(myBayesianAnalysis,...
'badChains', newerbadChainsIndex,...
'prior', 1000,...
'priorPredictive', 1000,...
'posteriorPredictive', 1000);
% start of third acceptance plot with marked bad chains
uq_display(myBayesianAnalysis, 'acceptance', true);
hold on;
ChainIndex =1:Solver.MCMC.NChains;
newerBadChainIndexIndex = ChainIndex(newerbadChainsIndex)
newerBadChainAccpetancw = myBayesianAnalysis.Results.Acceptance(newerbadChainsIndex)
scatter(newerBadChainIndexIndex,newerBadChainAccpetancw, 'red', 'filled');
% 'Displayname','bad chains');
legend('all chains', 'newer bad chains');
% end of third acceptance plot with marked bad chains
uq_display(myBayesianAnalysis)
First generated acceptance plots with marked bad chains
Second generated acceptance plots with marked bad chains
Third generated acceptance plots with marked bad chains
Greetings
Olaf