Hello, I have 3 input parameters: X1, X2, and X3 that I ran through a CFD model 50 times to obtain Y1, which is my output. So I’m trying to perform sensitivity analysis to get the sensitivity indices.
I used PCE to construct a surrogate model so I can perform the sensitivity analysis and this is the code:
X = load(‘X.csv’);
Y = load(‘Y.csv’);
% Define input parameters
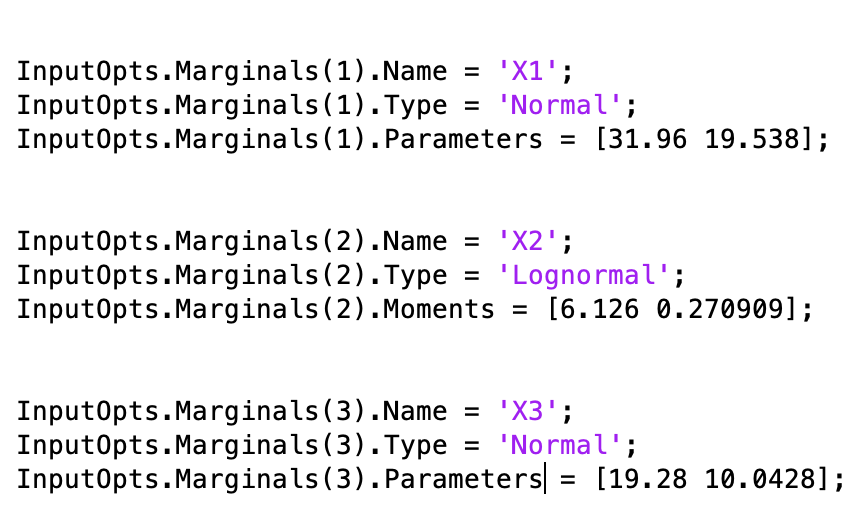
InputOpts.Marginals(1).Name = ‘X1’;
InputOpts.Marginals(1).Type = ‘Weibull’;
InputOpts.Marginals(1).Moments = [36.2 1.14642];
InputOpts.Marginals(2).Name = ‘X2’;
InputOpts.Marginals(2).Type = ‘Weibull’;
InputOpts.Marginals(2).Moments = [6.16 0.118322];
InputOpts.Marginals(3).Name = ‘X3’;
InputOpts.Marginals(3).Type = ‘Weibull’;
InputOpts.Marginals(3).Moments = [35.8 1.14642];
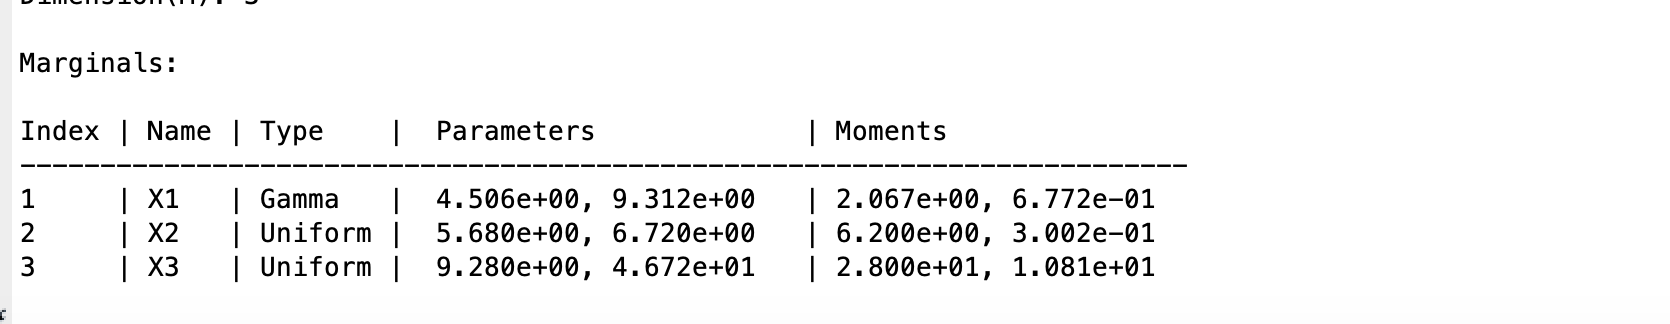
myInput = uq_createInput(InputOpts);
%Select PCE as the metamodeling tool
MetaOpts.Type = ‘Metamodel’;
MetaOpts.MetaType = ‘PCE’;
% Use input parameters
MetaOpts.ExpDesign.X = X
MetaOpts.ExpDesign.Y = Y% Set the maximum polynomial degree to 5
MetaOpts.Degree = 1:5;
% Create the metamodel object and add it to UQLab
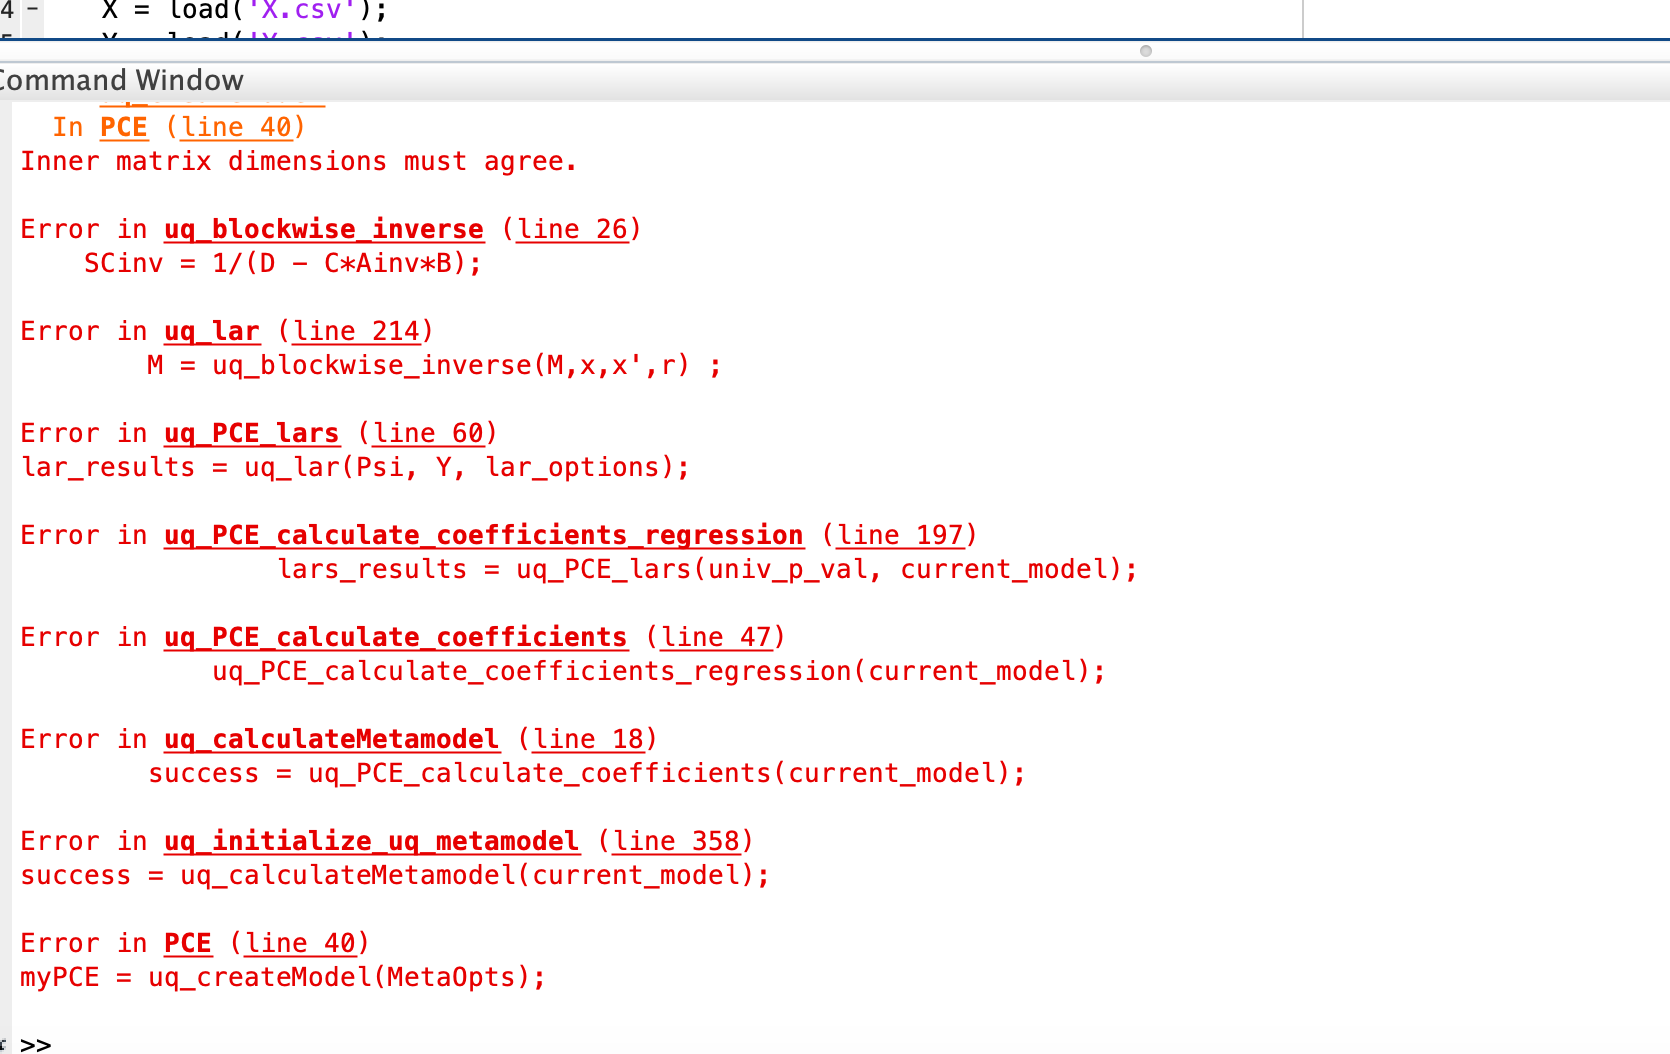
myPCE = uq_createModel(MetaOpts);
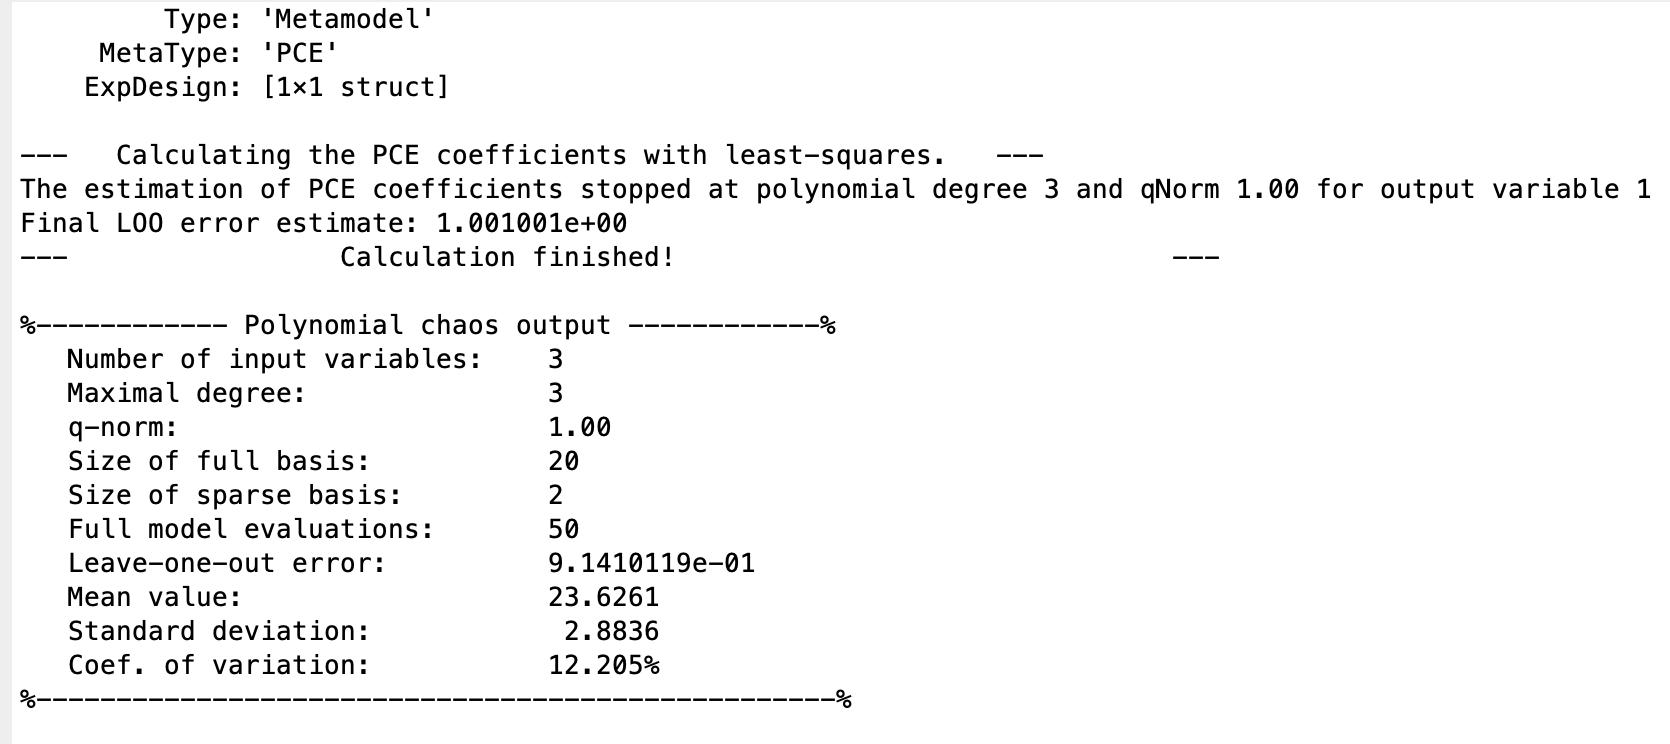
% Print a summary of the resulting PCE metamodel
uq_print(myPCE);
% Computing Sobol indices
SobolOpts.Type = ‘Sensitivity’;
SobolOpts.Method = ‘Sobol’;
SobolOpts.Sobol.Order = 1;
mySobol = uq_createAnalysis(SobolOpts);
% print the Sobol’ indices
uq_print(mySobol)% display the Sobol’ indices
uq_display(mySobol)
The first and second sobol indices were both 1, so I’m wondering where I went wrong. I’ve attached the data as well.
parameters.xlsx.zip (28.8 KB)
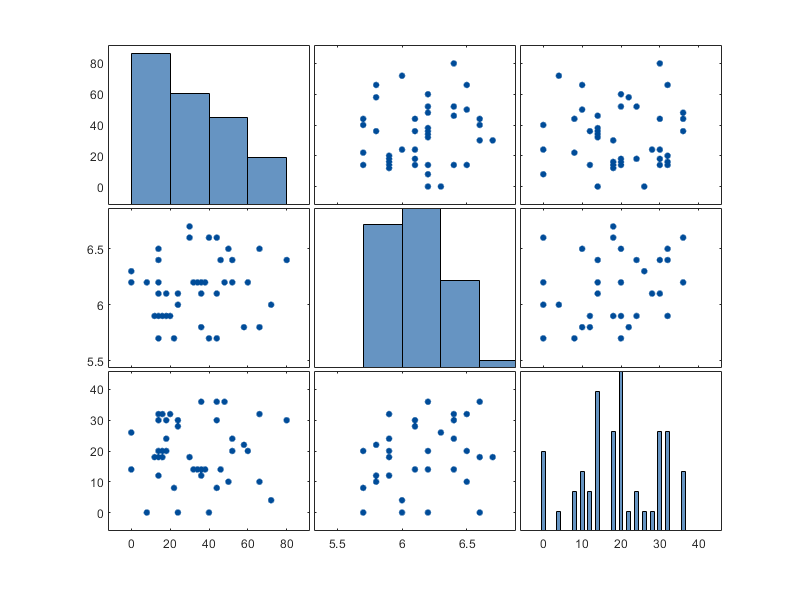 Figure 1: Scatter plot matrix of the data (X).
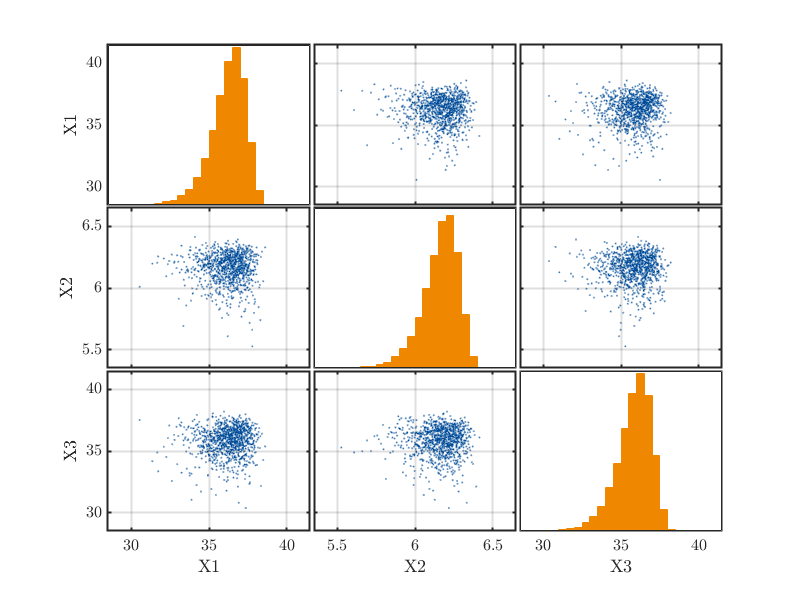 Figure 2: Scatter plot matrix of the Weibull distributions specified in the INPUT object.