Sampling strategies

Hi,
I am not sure I quite fully understand the sampling strategies techniques. Especially the range of x-axis and y-axis that I obtained from my model. it is not always that the sampling should be showing that the samplings are extracted from values (0 to 1) ? Below is my figure from running all 4 sampling strategies.
image

Thanks for your input!
B,;
Visha

Dear @Vishashalu

Can you share the code you used to generate the figures? I assume you are already plotting the transformed input (from the unit interval to your actual distribution).

Best regards
Styfen

clearvars
uqlab
rng(100, 'twister')
ModelOpts.mFile = 'uq_Abs';
myModel = uq_createModel(ModelOpts);
InputOpts.Marginals(1).Name = 'dens'; 
InputOpts.Marginals(1).Type = 'Gaussian';
InputOpts.Marginals(1).Moments = [1  0.043];
InputOpts.Marginals(2).Name = 'surfT'; 
InputOpts.Marginals(2).Type = 'Gaussian';
InputOpts.Marginals(2).Moments = [1   0.025];
myInput = uq_createInput(InputOpts);

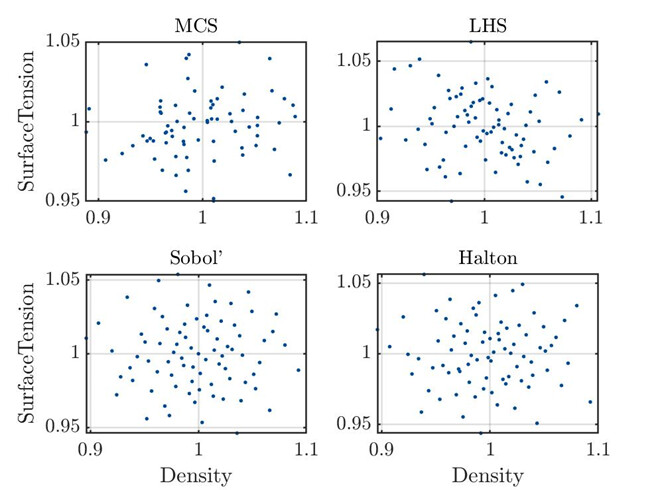
X_MC = uq_getSample(100,'MC');
uq_figure
uq_plot(X_MC(:,1), X_MC(:,2), '.', 'MarkerSize', 15)
xlabel('$\mathrm{Density}$')
ylabel('$\mathrm{Surface tension}$')
% 
X_LHS = uq_getSample(100, 'LHS');
uq_figure
uq_plot(X_LHS(:,1), X_LHS(:,2), '.', 'MarkerSize', 15)
xlabel('$\mathrm{X_1}$')
ylabel('$\mathrm{X_2}$')
% 
X_Sobol = uq_getSample(100,'Sobol');
uq_figure
uq_plot(X_Sobol(:,1), X_Sobol(:,2), '.', 'MarkerSize', 15)
xlabel('$\mathrm{X_1}$')
ylabel('$\mathrm{X_2}$')
% 
X_Halton = uq_getSample(100,'Halton');
uq_figure
uq_plot(X_Halton(:,1), X_Halton(:,2), '.', 'MarkerSize', 15)
xlabel('$\mathrm{X_1}$')
ylabel('$\mathrm{X_2}$')
uq_figure

subplot(2, 2, 1)
uq_plot(X_MC(:,1), X_MC(:,2), '.', 'MarkerSize', 15)
title('MCS')
ylabel('$\mathrm{Surface Tension}$')

subplot(2, 2, 2)
uq_plot(X_LHS(:,1), X_LHS(:,2), '.', 'MarkerSize', 15)
title('LHS')

subplot(2, 2, 3)
uq_plot(X_Sobol(:,1), X_Sobol(:,2), '.', 'MarkerSize', 15)
title('Sobol''')
xlabel('$\mathrm{Density}$')
ylabel('$\mathrm{Surface Tension}$')

subplot(2, 2, 4)
uq_plot(X_Halton(:,1), X_Halton(:,2), '.', 'MarkerSize', 15)
title('Halton')
xlabel('$\mathrm{Density}$')

Hi Styfen,
I think there is some formatting issue here, but I hope you can understand the code on how I input for the sampling strategies?
I will appreciate your input for this.
BR,
Visha

Dear @Vishashalu

I fixed the formatting issue.

uq_getSample will indeed return you the samples according to the distribution defined. You can read more about this function and related ones here:

Best regards
Styfen

Hi styfen,
With regards to the sampling strategies types in UQLab. Can you please confirm my understanding. I am a little confused. Is that when I specify to use Sobol or Halton type of sampling strategies, my input parameters must be uniform distributed to have more accurate outputs for convergence analysis. Will it be wrong if I specify gaussian distribution type for my inputs?
Thanks!
Visha

Dear @Vishashalu

You can use all of these quasi-random sampling methods even if your distribution is not uniform. In your first post, you asked why the generated samples are not within the unit hypercube, which is what you would expect from LHS, Sobol’, and Halton. The solution to this question is that UQLab applies an isoprobabilistic transformation to the generated samples in the unit hypercube to obtain the distribution you specified (Gaussian in our case). You can therefore safely use these sampling methods to generate samples following any distribution implemented in UQLab.

Best regards
Styfen

Hi Styfen,
Thank you so much for clarifying my doubt about that. As I have seen in several references and papers, Sobol as LDS method always showed superior, however with my computational model, I did get the same outcome. In fact, my convergence plot for mean value doesnt shows much changes from the exact value and each sampling strategies reaches convergence relatively quickly. Is there any other statistical values besides mean value that I could check for convergence?
Visha

Hi @Vishashalu,

I jump into the conversation here :slight_smile:
You could try to check if the variance of your output does not change for different sample sizes. I would expect your variance to no longer vary at a given sample size. That would also be the minimum sample size you need to represent your model.

As for the convergence of your mean value, is the MC as fast as the other methods? Maybe you could show them here as well if it is not too much work :grin:

I hope this was helpful.

Best
Gian

Hi Gian,
Yes I should have showed them here. There you go:
image
This is my output for the mean. The exact value is 89.5.
Thanks for your input.
BR,
Visha

thank you for this :slight_smile:

although there is a very small difference, but have you analyzed the reason why your sampling never reaches exact value?

Hi Gian,
I am actually not sure how I should move forward with my analysis. Do you think I should try to run with much bigger sample size? I have tried multiple runs of these simulations and it always ends up with the same conclusions.
Visha

Hi Visha,

After analyzing your answer better, I noticed you mentioned that the exact value is 89,5. However, in your plot, the exact value is displayed at 90,0.

After you investigate this, it would be beneficial to know your exact value. Is it computed from your model or known from the literature?
Also, how do you compute the mean from your samples? If you use the same model for the exact mean and your sample mean, then you must get the same values.
At first glance, I may think that there is some problem in the coding of your model.

Keep me updated :grin:

Hi Gian,
Ok I will do that…Thanks a lot for the advise. I will have to check with my deterministic output again then. I will keep you posted here later.
Thanks.
Visha

1 Like