cmap = uq_colorOrder(2);
uq_histogram(Yval, ‘FaceColor’, cmap(1,:))
hold on
uq_histogram(YPCE, ‘FaceColor’, cmap(2,:))
hold off
xlabel(’\mathrm{Y}’)
ylabel(‘Counts’)
uq_legend(…
{‘True model response’, ‘PCE prediction’},…
‘Location’, ‘northwest’)
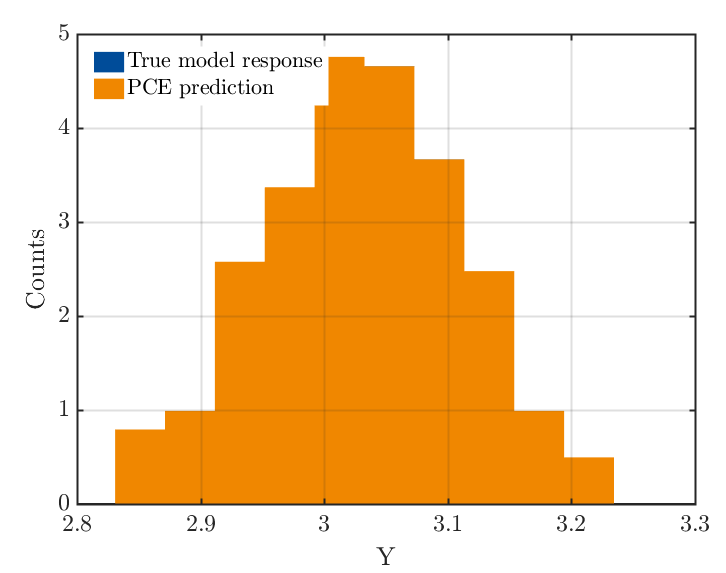
Hi! Above is my code according to the example “PCE from existing data: Truss data set”,but in the histogram the counts are not integers but decimals,besides ‘True model response’ in color blue is not displayed, why?
Welcome to UQWorld! Small hint: if you start and end the code section with ``` (three apostrophes), the code will be displayed properly as code and not as plain text. And please, next time you ask a question that is not directly related to an existing one: just open a new topic. Thanks!
Now to your questions:
by default, uq_histogram normalizes the histogram, as explained in the beginning of the file uq_histogram.m:
%   UQ_HISTOGRAM(Y) plots a histogram of a column- or row-vector Y with
%   normalized values (i.e., the total area under the histogram is 1.0).
My guess is that Yval and YPCE are identical and therefore the blue histogram is completely covered by the orange one… is that possible? Is your model a polynomial?
I’m not sure what you mean with “PCE that is not normalized”, can you clarify?
I meant that the values of the histogram are plotted normalized (see here for an explanation of different normalization options, although uq_histogram is not based on Matlab’s histogram function)
Regarding your second question, if you set a breakpoint in your code at the line saying hold on, you should see the blue histogram before it is covered by the orange histogram.
The histogram that you posted above is normalized.
As you observed, uq_histogram does not plot plain counts (=integers), but normalized values so that the total area under the histogram is 1.0. You can check line 134 in uq_histogram.m to see how the normalization factor is computed from your data.