First of all, thank you for such an amazing UQ toolbox.
I am majoring in Aerospace engineering and is looking into wind energy topic.
As I am building the probabilistic input models, I found that when running the uq_createModel function, the computational time is exceptionally long (when using the Quadrature method). I am suspecting this is because I have too many inputs marginal as reducing the number of them can make the computation faster.
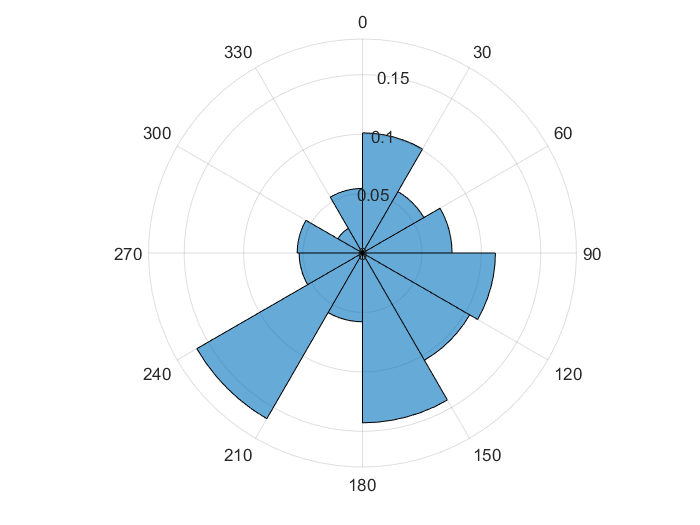
The reason I am building up so many inputs is that I am trying to create different wind roses with different sector probabilities. Thus, if a standard wind rose has 30 degrees per sector, I will have 12 sectors for [0, 360] degree, while each marginal represents one sector with probability less than 1. Further, the probabilities for the 12 sectors should have a fixed sum of 1. An example of wind rose is shown below.
for ii = 1:n_sector
    InputOpts.Marginals(ii).Type = 'Gaussian';
    InputOpts.Marginals(ii).Parameters = [0.5  0.1];
    InputOpts.Marginals(ii).Bounds = [0, 1];
end
I tried to utilise copulas to correlate the variables but failed to do so.
(I am not familiar with copulas, but I have tried all the example usages from the input manual and inference manual and still can not get a fixed value sum.)
Therefore, instead of defining dependency at the input marginal, I am currently altering the sector probabilities in the computational model to have a fixed sum even though I believe it is not recommended to do so.
Is there a way to have this dependency between these marginal when defining input models?
Welcome to UQWorld and thanks for the kind compliment!
I see two questions in your post:
Why is PCE with quadrature so slow?
What is an appropriate probabilistic model for the wind rose?
Regarding question 1, the answer is that the number of model evaluations required for PCE by quadrature is (p+1)^M, with p the degree and M the number of input variables, as explained in the PCE user manual in section 1.4.1. Even if you just use p = 3 with 12 inputs, this results in more than 16 million model evaluations. It is much more efficient to use sparse regression to compute the PCE coefficients (PCE manual section 1.5.2, and 2.5.3). You can even evaluate the model beforehand, save the evaluations, and provide it to the PCE module manually (see “Manually specify an experimental design” on p. 35 of the PCE manual).
For question 2, this is how I understand your question: The wind rose, i.e., 12 values that add up to 1, are inputs to your computational model. You want a probabilistic model for these 12 values.
This is an interesting question! To have the values sum up to 1, the first idea that comes to my mind is that you should only draw 11 values, and determine the last one by the difference of their sum to 1. But what if the sum of the 11 values is already larger than 1? So this is not a solution.
Do you know anything about the wind rose? In the example you give, you use Gaussian distributions for the sector probabilities, but is choice based on your knowledge or arbitrary? Do you have more information about the distribution of the sector probabilities than that all 12 sector probabilities should have the same distribution (or is this even the case)?
Regarding the wind rose distribution:
It turns out that you cannot just use any distribution, if you want all 12 values to have the same distribution. The general idea is that your problem is equivalent to sampling from the probability simplex in 12 dimensions (which is defined by 0 <= x_i <= 1 for all i, and sum_i x_i = 1). So you need to find a distribution on the probability simplex that is symmetric, so that the marginals along any axis are the same.
One possibility is to sample uniformly from the simplex. This corresponds to “breaking a stick D-1 times at random locations” (see https://www.youtube.com/watch?v=qTRW7ELhhME for an explanation in 3 dimensions). You can divide the interval [0,1] into D parts by drawing D numbers ~ Unif([0,1]), ordering them by size, adding 0 in the beginning and 1 in the end, and then taking the difference between subsequent numbers as values for x_1, x_2, etc. This results in a distribution with a peak at 0, which has the shape of a (D-2)-degree polynomial for a division into D parts. Here is a derivation of its pdf: http://statweb.stanford.edu/~susan/courses/s116/node79.html (look at the formula for f_min).
Using this pdf, you can sample D-1 = 11 values independently, and determine the last one as 1 minus the sum of the 11 other values inside the computational model (it will by construction have the same distribution as the others).
Of course, the resulting distribution is a very specific distribution that might not fit with your knowledge about the wind rose. It is important that you choose not just any distribution, but one that fits well with what you know about it.
The distribution that allows to sample numbers between 0 and one such that the sum is one is the Dirichlet distribution. By tuning the hyperparameters \boldsymbol{\alpha} you can get different weights for your 12 directions. This distribution is however not implemented in UQLab.
Best regards
Bruno
Thanks for the information. I actually looked up the Dirichlet distribution before I raised my topic here in the UQWorld. I am wondering if I can create the distribution by myself and use the inference function in UQLab to be the Input models for my PCE model.
To @nluethen, many thanks for your suggestion. I am still processing the information you mentioned. I will get back to the topic later. Regrading the ‘Gaussian distribution’ in the example I gave, it is just an arbitrary setup to test out the wind rose.
The probabilistic model retained in UQLab is “marginals + copulas”, which is natural for many types of distributions, yet difficult to implement for the Dirichlet distribution.
As a short answer, it is currently not possible to easily implement a user-defined multivariate PDF in UQLab. We may consider this in future versions.
Best regards
Bruno