Ask a question about copula.
‘uq_Example_input_02_MarginalsAndGaussianCopula’
I would like to ask a question based on the example above.
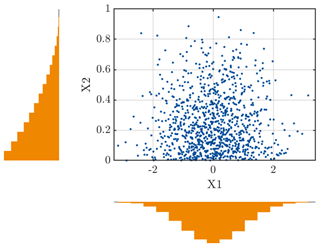
X1 is set to gaussian [0, 1] and X2 is set to beta [1 3].
Y = f (X1, X2)
In my opinion, I confirmed that the distributions of X1 and X2 are the gaussian and beta distributions respectively, and understood that they are the data points to extract the blue points.
-
The data distribution is not known until the data is extracted. How do I set up? For example, do i has to make assumptions about uniform distributions, or inferred from the background knowledge of my data?
-
What I want to do is data driven PCE.
Y = f (X1, X2, X3, X4, X5)
In the function configured as above, am i going to figure out the distribution of each of X1, X2, X3, X4, X5 by the method obtained in 1), and find the point of data to extract?
(Like ‘uq_Example_Input_07_inferMarginalsAndCopula’ )
(I have a lack of understanding about copula, so I would like to ask a basic question.)