Once the PCE is bulit,we can get statistical moments.
But I ask how to perform Monte Carlo simulation based on the bulit PCE model to get histogram of output,and store the sampling output of Monte Carlo simulation.
It’s in fact so straightforward that there is no example on this. We should add it!
Using the example mentioned by @styfen.schaer , once your PCE is built you use the following code:
N_MCS = 10000 ;                  % size of your sample for histogram
XX = uq_getSample(N_MCS);        % sample the inputs from myInput
YY  = uq_evalModel(myPCE,XX);    % evaluate the PCE on the XX sample
hist(YY)
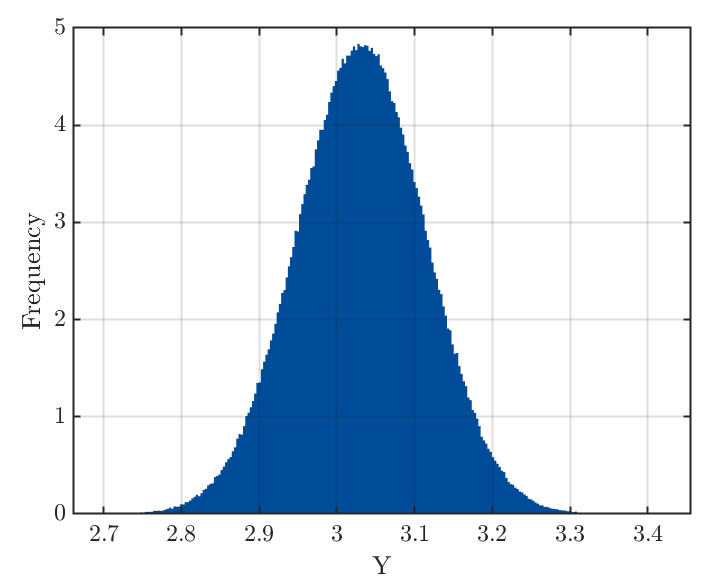
By default the histogram created by uq_histogram is already normalized though perhaps not normalized the way you want it. Specifically, the normalization is done such that the area under the histogram is equal to 1. Unless you don’t turn the normalization option off (via named argument 'Normalized'), the y-axis of the histogram produced by uq_histogram is not frequency (i.e., not raw counts). If the area under the curve must be 1 (representing a PDF), then the values at the y-axis do not need to be less than 1.
As already pointed out by @styfen.schaer, the Matlab function histogram does provide several other normalizations not available in uq_histogram. The 'pdf' normalization in histogram is the same as the default normalization of uq_histogram. Note that the 'probability' normalization simply normalizes the histogram with the total number of data points and the area under the histogram won’t be, in general, summed to 1.
I hope this clarifies a bit how uq_histogram work!