Dear all,
I have a question regarding data analysis, regression, and classification. I have to analyze the data you see in the figure.
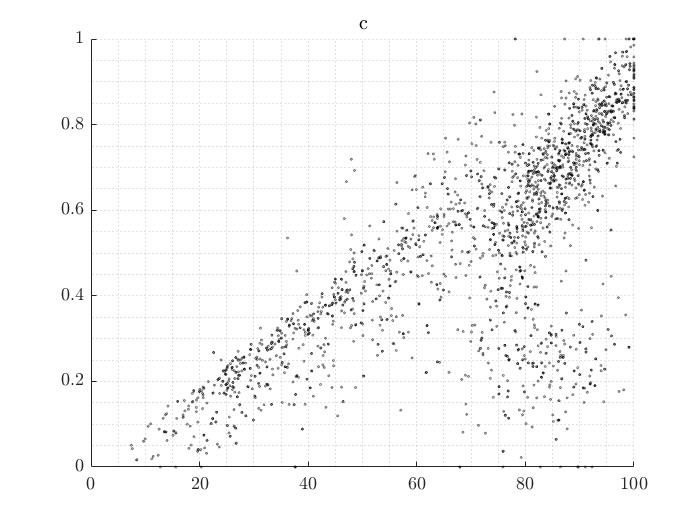
Each point corresponds to a model evaluation, the x-axis is my output, and the y-axis is a new model variable that I introduced after the model evaluation. The points have a slight transparency to highlight data overlapping. This picture refers to one particular region of my model. Therefore I would like to extract some information from this picture and infer it to other areas.
What I see in this picture is an apparent linear regression in the diagonal. In addition to that, there are also many data points in the lower right corner with a non-linear trend. In other words, the data points are distributed like a “mirrored lambda.”
My problem is that I do not know how to interpret those data. Can I assume that my new variable denotes a bifurcation? Meaning that there is a double mechanism going on? How would you separate the due point sets? I tried to select them manually, but there must be a more accurate way.
I hope I was clear enough. Please let me know if you want to know more details.
Thank you all 