Data-driven PCE and overfitting

Hello!
I conduce metamodeling using data driven based polynomial chaos expansion. I have some question about PCE.
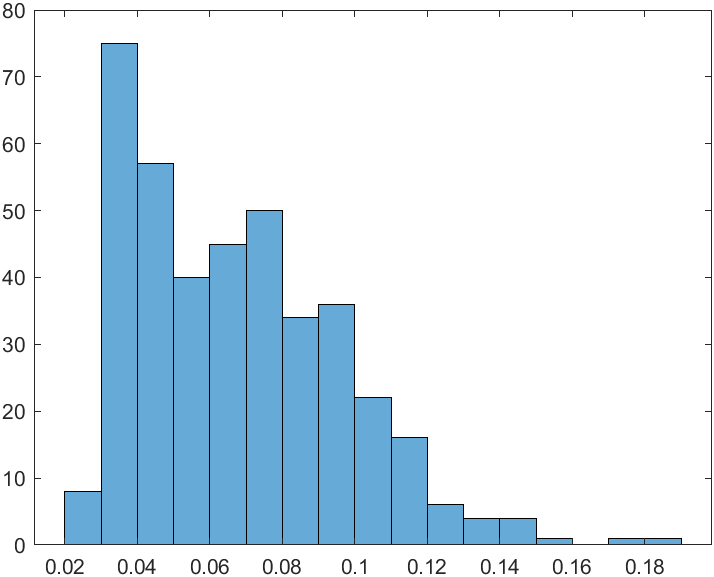
Computational fluid dynamics (CFD) data with 5 input variables is used, and the range of output variables is approximately 0.01 to 0.13. A total of 400 data were used, and the experimental design used LHS.
image
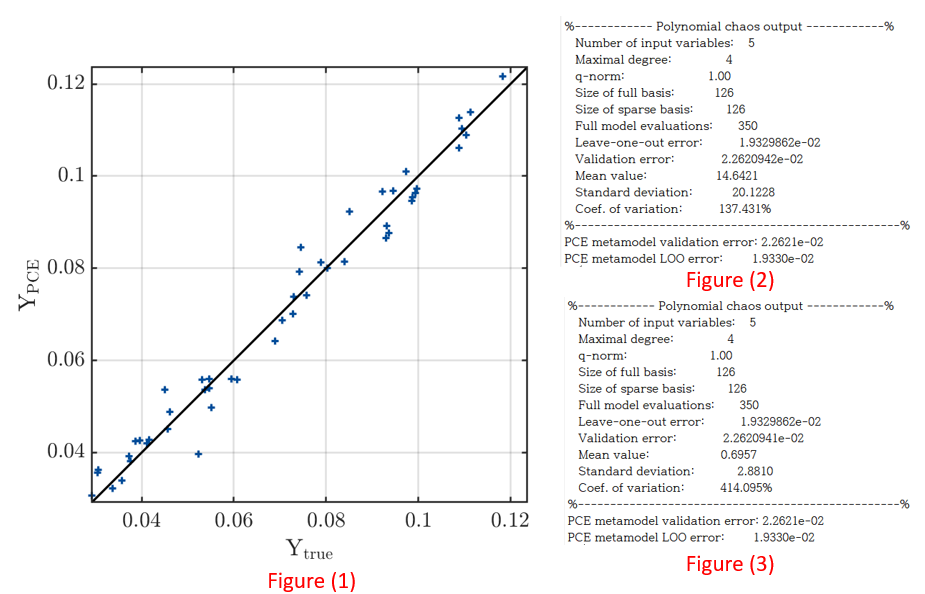
After PCE modeling, the fitting result is the same as figure(1) and the mean is 14.6421 as figure(2). However, considering that the maximum value of the output variable is 0.13, the fitting does not seem to be working properly. In other words, it seems to be overfitting that fits only the given data.

In addition, when the input variable was normalized between 0 and 1 using the normalize (A,‘range’) matlab function, it has the same LOO and validation error as figure(3), but when one input dataset is substituted, the output is 2 Is coming out with a value over. In other words, the fitting is still not working well.

I have some questions in this part.

(1) In my opinion, overfitting occurred due to the small number of data compared to the non-linearity of the data, so the mean value appears to be strange as shown in figure(2). Is this the only way to increase the number of data? Is there any way to prevent overfitting like dropout in neural network?

(2) Determining the degree of PCE is only increasing the order from 1 to finding the optimal degree? Declaring degree as 1:10 keeps converging at 1 degree.
(Actually, the error is the lowest at 4th degree.)

(3) I think that normalization like figure(3) should not change the result. However, in this case, as shown in figure(2) and figure(3), the mean and variance show a large difference. Is this also due to overfitting?

(4) Is there a paper to know the number of required samples according to the number of input variables?

I am looking forward to your advice. I sincerely ask for the advice of researchers.
If you want additional information of my problem please send e-mail to ‘minsu77@yonsei.ac.kr’
Thank you.

Hi @Chemicaleng,

400 points in 5 dimensions should be enough for a reasonable fit, unless the model is very non-smooth and thus not suitable for PCE. But it seems that your model can be approximated quite well by PCE: it seems you achieve a relative MSE of 0.02 with 350 points. Do I understand correctly that you are using 350 points as ED and 50 points as validation set? Does Figure (1) display the Y-Y plot of the validation set?

Have you checked the mean of your ED? I would expect that mean(YED) \approx mean of the PCE. The moments of the PCE typically converge quite fast. Since your validation set is quite small, it might well be that its mean is different from the one of your ED. Especially when the Y-data varies a lot. Have a look at a histogram of all your 400 Y’s. Are there maybe a couple of outliers with very high values?

Regarding the rescaling you mention, I am not sure what you want to achieve with this. UQLab anyways does internally a transformation to standard variables. But if you insist on doing it, make sure you normalize only X, not Y, and change the input object accordingly.
I just realized you are probably using arbitrary PCE. So there is no input object, and UQLab does not do a transform. You can of course rescale both X and Y, but you will simply get a rescaled version of the PCE (as you also observed: it even has exactly the same LOO and validation error, but different values for the coefficients). It won’t change the fit.

Regarding your other questions:
(1) Overfitting is prevented by using LOO for model selection.

(2) Yes, the total degree of the basis is increased according to the range that you specify in MetaOpts.Degree. The final basis is chosen as the one with the lowest LOO. If you say the error is lowest at 4th degree, you probably mean validation error - the PCE fitting does not use validation error. (If you specify a validation set, it is only used to compute the final validation error.)

(3) See my above remark about normalization.

(4) This is very much dependent on the properties of your model. Have a look at @bsudret’s answers to the following questions:

Good luck, and let us know how you solved your problem! :slight_smile:

2 Likes

Thank you for your kindly reply! :slight_smile:
image
Upper figure is the histogram of my Y value.
As you can see, all data is lower than about 0.19. however, mean value calculate by PCE is 14.7160.
I think it is so weird…(You said mean of Y_experiment design = mean of the PCE)
Additionally i check LOO, @bsudret said when LOO error shows about 0.01, that model is good enough. but, when i check ‘myPCE.Error’ LOO is 0.0193, Val is 0.0226, ModifiedLOO is 2.80623+e05
, i think ModifiedLOO is too large…isn’t it?

finally i have some question!

  1. In UQLAB, as you left it as a comment, it is automatically normalized, so does it need to be normalized?

  2. What is different between LOO and ModifiedLOO ?

  3. As i know, OLS method is better than LARS method. it is always right?

  4. Is LOO a value that is not affected by the scale of Y?

  5. When i extract data point using experiment design(like LHS), how can i choose the number of point?
    @bsudret said Number of ED = 10*Inputdimension

  6. The mean value of my ED is about 0.0675 but mean of PCE is about 14. i think is not feasible. i wand your comment about this result.

Thank you!

Hi @Chemicaleng,

Does the histogram you show use all 400 data points? Then there is indeed something weird going on in your PCE fit. Also, the modified LOO is much too large. It sounds like your regression matrix might be ill-conditioned.

  1. If you have specified 'arbitrary' as the polynomial type of your PCE (see PCE user manual, section 2.1.4), then the input is not automatically normalized.
  2. See PCE user manual, section 1.4.3.
  3. No, that’s not right. You can only apply OLS if you have more points N than polynomial regressors P (with an oversampling rate of at least 2, i.e. N \geq 2P) (at least if you care about a robust estimate). Whereas you can use LARS already if N < P, since it is looking for a sparse solution. Also, sparse regression acts as a denoiser. Often, LARS finds much better solutions than OLS (and with less points).
  4. Since UQLab always uses relative errors (scaled by the variance of Y), the LOO error should be scale-independent.
  5. Bruno’s suggestion is a good rule of thumb. Of course the more points you can afford, the better.
  6. No indeed, this sounds very strange. Have a look at your raw data (scatter plot plotmatrix of input samples, scatter plot of input against output, and histogram of all 400 points). Does it look reasonable? What is the distribution of your input random variables? Do you use arbitrary PCE? If not, i.e. if you define an input object, explicitly assign it to the PCE to make sure the right one is used: MetaOpts.Input = myInput;
    Do you use LARS or OLS, and with what settings?