Dear UQLab,
Many appreciate the sustainable support of UQTeam.
Recently I am stuck with a problem:
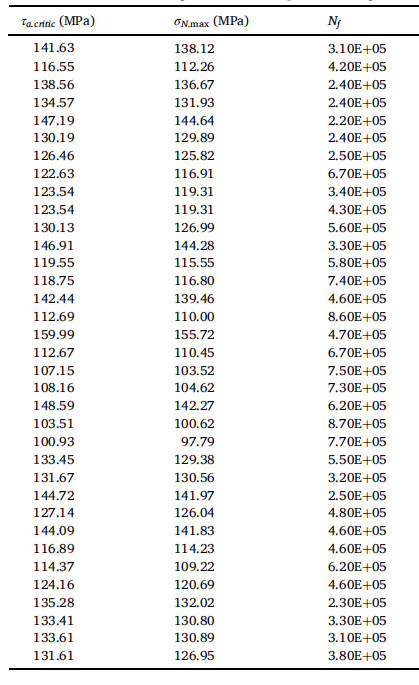
I want to construct a high-precision PCE model of the data in the following figure ,the first two columns are the inputs and the third column is the output, the first 25 sets as DOE and the last 10 sets as the validation set
But I don’t know what kind of distribution the data follow and what the mean value of the distribution is.?
I tried to use the statistical inference tool in the INPUT module to infer the type of distribution they follow, but the accuracy of the constructed PCE model is still not satisfactory (best LOO > 0.3)
I am not sure what could be the reason for this, could it be that the data itself is not suitable for metamodeling?
Thanks again to UQLab, a milestone tool that has helped me tremendously!
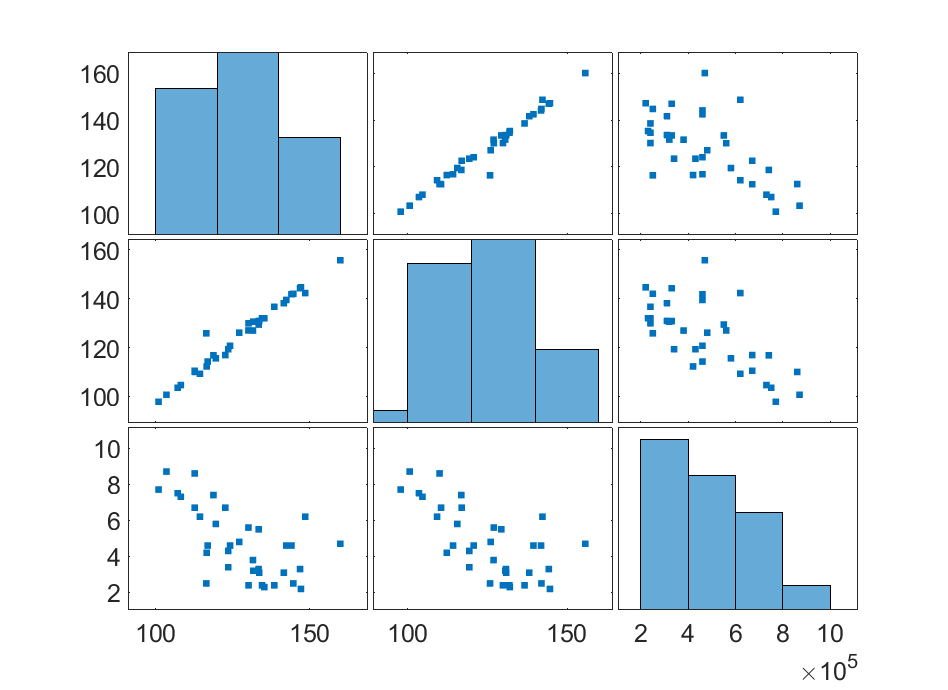
As a general advice, you should always plot your dataset using plotmatrix first. In your case, we get the image below:
You see that the two variables X_1 and X_2 are almost perfectly correlated. Moreover, the third parameter (what you call output) is loosely correlated to the first ones. In other words, there is no deterministic mapping between (X_1,X_2) and Y. You cannot apply PCE (nor any other standard surrogate) in this context.
Dear Prof.
I can hardly express my gratitude for your reply.
I understand the reason for the error, and thank you very much for your valuable advice.
Thanks again!
Dear Prof.
Thank you very much for the advice on plotmatrix, but I couldn’t find the usage for this handle in the user of INPUT and Statistical inference module.
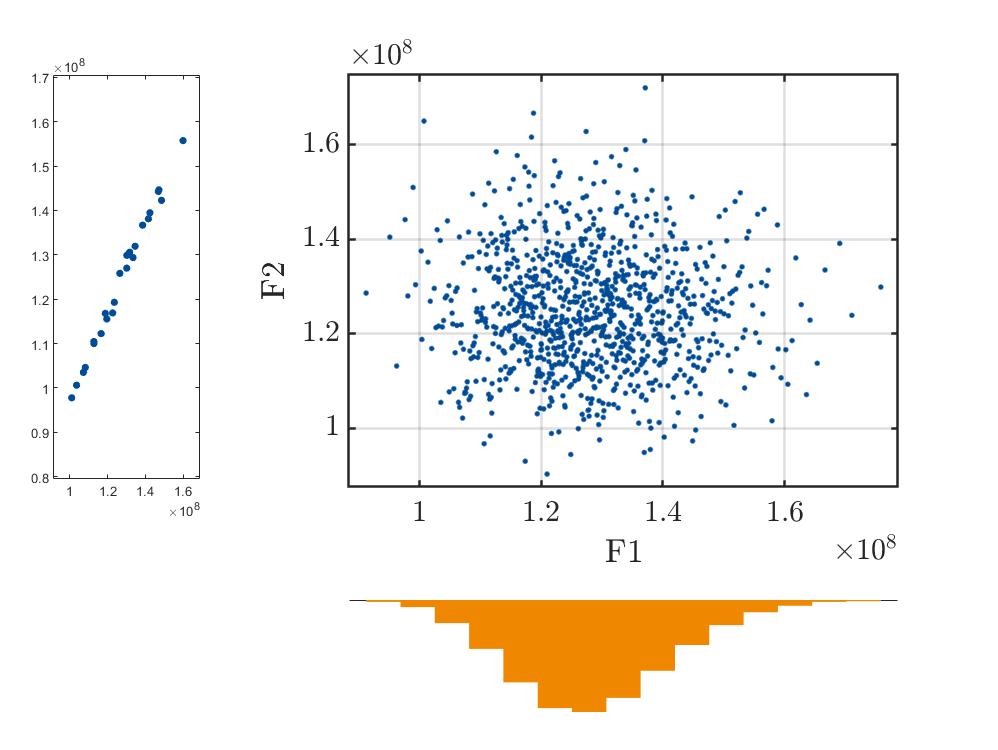
I can only analyze the correlation between X1/X2/Y step by step by trying to draw the following diagram
Hello, the prerequisite for using the PCE method is that the variables are independent of each other in order to obtain a more accurate PCE model. Also, may I ask how you implemented ‘I trie to use the statistical inference tool in the Input module to infer the type of distribution they follow’ using uqlab?