I am currently working on the UQ of two complex numerical models A and B. I can obtain 500 y_A and y_B with reasonable time. My goal is to find the correlation coefficient between y_A and y_B, i.e., r_AB, and conduct sensitivity analysis on r_AB. I am thinking about using metamodels to generate y_A’ and y_B’ and then find r_AB and Sobol’ indices for SA. Is there any ways to justify the usage of metamodels? I think in order to justify it, I should some how demonstrate that the metamodels will provide more accurate results than just a few hundreds outputs y_A and y_B generated by the numerical model. I am not sure if my thinking is correct. Looking forward to your comments. Thank you very much.
Hello,
I am not an expert but I often use metamodels and sensitivity analysis for engineering applications, so I’ll try to do my best to help.
I am not sure to understand your problem statement :
For me, the correlation coefficient between y_a and y_B is not a variable of your inputs : you do not have a local result, but it depends on the whole set y_a and y_B. To put things differently, I can’t switch to a problem of the form r_{AB} = f(X) (where X is your input).
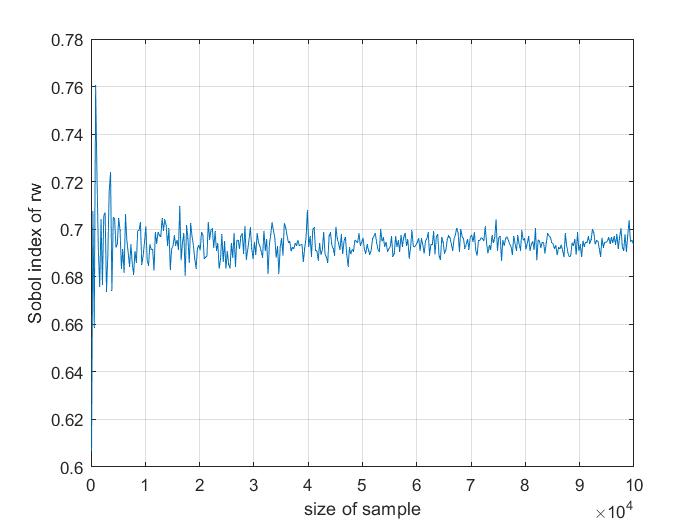
Generally speaking, if you want to compute Sobol indices, I think you need much more samples than 500, and metamodels will help you there. Here is a graph of the Sobol total index, in the example 2 of the sensitivity (in UQLab files). I modified the sample sized, and I display the Sobol index (of the first input, the most influential) to estimate the accuracy of the sensitivity analysis :
For small sample sizes, the Sobol analysis is not really accurrate (the Sobol index is 0.6 with 250 samples, and 0.76 for 500 samples).
Sorry that I didn’t state my questions correctly. r_AB is a statistic of the outputs, so there would not be sensitivity analysis on r_AB. My tasks are to find r_AB and conduct SA on y_A and y_B.
If I understand correctly, the figure you presented shows that the MC-based Sobol’ index converges slowly with the increasing sample size. And based on the result of example 2, I understand that PCE-based Sobol’ index can achieve a high accuracy with only 200 samples.
Now the question is:
In order to generate the sample size vs. MC-based Sobol’ index figure (only from that I can see where the index converges to, i.e., the “real” value of the index), I need to run the computational model for 1e4 or even 1e5 times which is extremely time consuming and may not be possible to finish. Therefore I am not able to obtain a accurate Sobol’ index. So I would not know if my PCE model gives me accurate index or not.
Thank you again for your kind reply. I hope I state my question clearly enough.
I think the key point in the PCE based Sobol analysis is the accuracy of the PCE. As I understand the sensitivity analysis, since it is a global result, an accuracy of 1 to 3 percent is sufficient to estimate the Sobol indices. Note that for a reliability analysis, I would try and obtain a more accurate metamodel (since the focus is on a local part of the results). Of course, the more your PCE is accurate, the more you will get an accurate Sensitivity analysis.
Finally to estimate the accuracy of your PCE, you can use the LOO error, or validate your PCE on new samples, say 100 iterations (it can be useful to display the graph (Y_{FEM}, Y_{PCE}) on the validation sample). But based on your other topics, I think you know how to deal with this part.
To conclude if your PCE is accurate, the Sobol analysis with the PCE would be close to the one made on 10^6 sample with a MC-based Sobol analysis.