Hi @AmosJoseph
A sensitivity index of 0.99 suggests that the random variable is the only one affecting the output. However, it does not say anything about linearity.
Can you paste all sensitivity indices and the PCE coefficients?
To clarify if I understood your question correctly: You plot the input variable with the highest sensitivity index of 0.99 against the model output (the labels would be helpful to understand your plot). You observe an almost perfectly linear relationship between the two. Your surrogate has a LOO value close to zero.
If this is all correct, you are in luck. The model you are trying to surrogate is essentially a linear model with only one relevant input variable and you have obtained a perfect surrogate for it.
In my opinion, for sensitivity analysis, the variability of the input variable is small.
The relationship appears linear, this is only true in a small range, not essentially the whole domain of the input variable. The variability of the input variable has an impact on output variability, and the input variable is sensitive to the output .
All input variables are important in the viewpoint of principle component analysis. It is a multi-variable problem.
“The model you are trying to surrogate is essentially a linear model with only one relevant input variable”, I think this is not true.
sorry for the delay. Thank you @styfen.schaer for jumping in
I agree with Styfen about the linearity of the model. Having a look at the PCE coefficient may clear out any doubt. I expect to see the coefficient related to the very sensitive variable as the highest while all others are proximal to zero.
Another test you could perform is to plot the input data points you feed to the PCE evaluation vs. the output. Then overlap with the PCE solution points on the plot. If they match, the surrogate model is accurate. However, there are no doubts since you already have a very good LOO and validation errors.
Number of input variables: 9
Maximal degree: 1
q-norm: 1.00
Size of full basis: 10
Size of sparse basis: 7
Full model evaluations: 10
Leave-one-out error: 1.3566427e-04
Validation error: 1.3926611e-04
Maximal degree: 1, it is a linear model!
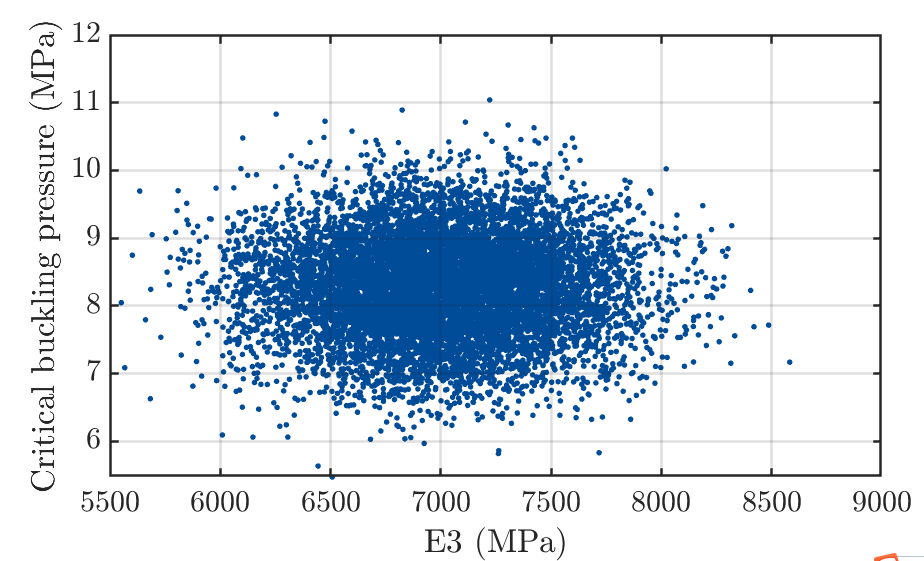
But why the scatter plot of an input (Sobol index :0) variability vs output variability is like this? Should not it be alos linear as a linear model is got?
Why would you expect a variable with a Sobol index of zero to be linearly correlated with the output?
To me, this looks as expected. Your linear model still has a relatively small error, suggesting that your true model is indeed close to linear. You can even try to fit a PCE with degree 1 and use only the input variable with the highest Sobol index. I still expect the model to be reasonably accurate.
Pardon, for a linear model, other variables are considered constant, then the relationship between output and variable with a Sobol index of zero will be linear. Then how to explain the scatter plot ?
I am afraid I have to disagree that the other variables should be constants. They are still random variables. The thing is that their coefficients are small, which makes them unimportant to the problem. Indeed, this is why their Sobol indices are small. Then, because they are insignificant to the problem, they will not significantly affect your output, independent of their scatterplots. For instance, the shape of the scatterplot can be linear, constant or anything. It does not matter because the variable is unimportant. I hope it has solved your question. If not, just let us know!
Other variables are treated as constants, then the relationship between output and a certain random variable is obtained shown in scatter plot. Actually all variables are random.
I think all variables are important. In fact, variables are mechanical properties of composite material. They have a effect on output.
Some variables have small Sobol indices, showing they are not sensitive to output. Variabilities in these variables have small impact on output variabilities.